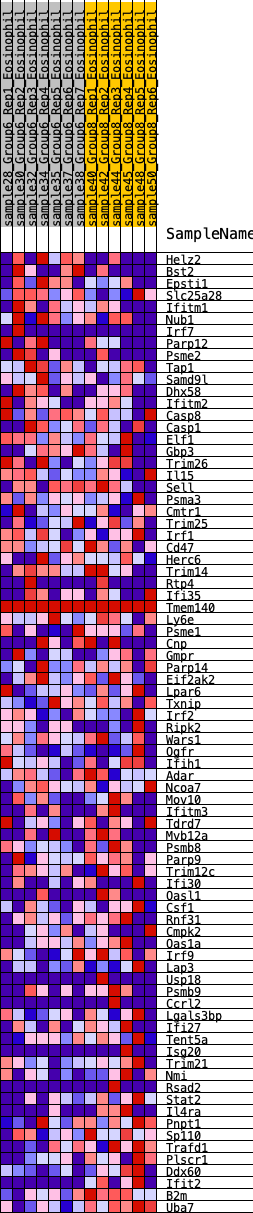
Profile of the Running ES Score & Positions of GeneSet Members on the Rank Ordered List
| Dataset | Eosinophil.Eosinophil_Pheno.cls #Group6_versus_Group8.Eosinophil_Pheno.cls #Group6_versus_Group8_repos |
| Phenotype | Eosinophil_Pheno.cls#Group6_versus_Group8_repos |
| Upregulated in class | 5 |
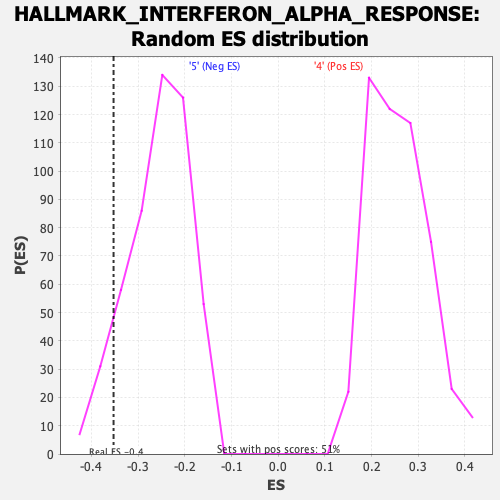
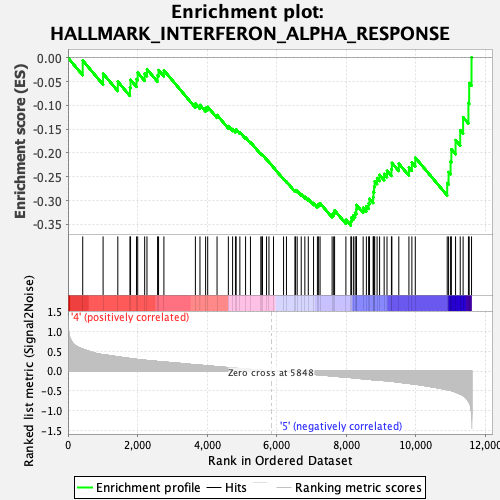
| GeneSet | HALLMARK_INTERFERON_ALPHA_RESPONSE |
| Enrichment Score (ES) | -0.35264874 |
| Normalized Enrichment Score (NES) | -1.3722973 |
| Nominal p-value | 0.09090909 |
| FDR q-value | 0.49586114 |
| FWER p-Value | 0.51 |
| SYMBOL | RANK IN GENE LIST | RANK METRIC SCORE | RUNNING ES | CORE ENRICHMENT | |
|---|---|---|---|---|---|
| 1 | Helz2 | 423 | 0.556 | -0.0057 | No |
| 2 | Bst2 | 1009 | 0.414 | -0.0334 | No |
| 3 | Epsti1 | 1432 | 0.359 | -0.0500 | No |
| 4 | Slc25a28 | 1781 | 0.316 | -0.0626 | No |
| 5 | Ifitm1 | 1798 | 0.315 | -0.0464 | No |
| 6 | Nub1 | 1970 | 0.296 | -0.0447 | No |
| 7 | Irf7 | 2004 | 0.292 | -0.0313 | No |
| 8 | Parp12 | 2204 | 0.275 | -0.0333 | No |
| 9 | Psme2 | 2270 | 0.268 | -0.0240 | No |
| 10 | Tap1 | 2575 | 0.242 | -0.0369 | No |
| 11 | Samd9l | 2603 | 0.239 | -0.0259 | No |
| 12 | Dhx58 | 2757 | 0.229 | -0.0264 | No |
| 13 | Ifitm2 | 3662 | 0.159 | -0.0960 | No |
| 14 | Casp8 | 3794 | 0.148 | -0.0991 | No |
| 15 | Casp1 | 3956 | 0.137 | -0.1054 | No |
| 16 | Elf1 | 4016 | 0.132 | -0.1032 | No |
| 17 | Gbp3 | 4285 | 0.110 | -0.1203 | No |
| 18 | Trim26 | 4610 | 0.087 | -0.1435 | No |
| 19 | Il15 | 4732 | 0.078 | -0.1497 | No |
| 20 | Sell | 4814 | 0.072 | -0.1527 | No |
| 21 | Psma3 | 4834 | 0.070 | -0.1505 | No |
| 22 | Cmtr1 | 4941 | 0.063 | -0.1562 | No |
| 23 | Trim25 | 5105 | 0.051 | -0.1675 | No |
| 24 | Irf1 | 5245 | 0.043 | -0.1771 | No |
| 25 | Cd47 | 5543 | 0.020 | -0.2018 | No |
| 26 | Herc6 | 5571 | 0.018 | -0.2031 | No |
| 27 | Trim14 | 5591 | 0.017 | -0.2039 | No |
| 28 | Rtp4 | 5708 | 0.008 | -0.2135 | No |
| 29 | Ifi35 | 5777 | 0.004 | -0.2191 | No |
| 30 | Tmem140 | 5908 | 0.000 | -0.2304 | No |
| 31 | Ly6e | 6197 | -0.017 | -0.2545 | No |
| 32 | Psme1 | 6280 | -0.023 | -0.2603 | No |
| 33 | Cnp | 6524 | -0.041 | -0.2791 | No |
| 34 | Gmpr | 6543 | -0.043 | -0.2782 | No |
| 35 | Parp14 | 6589 | -0.046 | -0.2796 | No |
| 36 | Eif2ak2 | 6705 | -0.054 | -0.2866 | No |
| 37 | Lpar6 | 6809 | -0.063 | -0.2920 | No |
| 38 | Txnip | 6908 | -0.071 | -0.2965 | No |
| 39 | Irf2 | 7059 | -0.080 | -0.3051 | No |
| 40 | Ripk2 | 7170 | -0.090 | -0.3096 | No |
| 41 | Wars1 | 7205 | -0.093 | -0.3074 | No |
| 42 | Ogfr | 7247 | -0.096 | -0.3056 | No |
| 43 | Ifih1 | 7593 | -0.122 | -0.3287 | No |
| 44 | Adar | 7638 | -0.125 | -0.3256 | No |
| 45 | Ncoa7 | 7664 | -0.126 | -0.3207 | No |
| 46 | Mov10 | 7989 | -0.152 | -0.3403 | No |
| 47 | Ifitm3 | 8132 | -0.163 | -0.3436 | Yes |
| 48 | Tdrd7 | 8147 | -0.164 | -0.3356 | Yes |
| 49 | Mvb12a | 8204 | -0.169 | -0.3311 | Yes |
| 50 | Psmb8 | 8254 | -0.172 | -0.3257 | Yes |
| 51 | Parp9 | 8289 | -0.175 | -0.3189 | Yes |
| 52 | Trim12c | 8292 | -0.176 | -0.3093 | Yes |
| 53 | Ifi30 | 8485 | -0.194 | -0.3151 | Yes |
| 54 | Oasl1 | 8578 | -0.201 | -0.3119 | Yes |
| 55 | Csf1 | 8643 | -0.208 | -0.3059 | Yes |
| 56 | Rnf31 | 8668 | -0.210 | -0.2963 | Yes |
| 57 | Cmpk2 | 8773 | -0.219 | -0.2931 | Yes |
| 58 | Oas1a | 8781 | -0.220 | -0.2815 | Yes |
| 59 | Irf9 | 8801 | -0.222 | -0.2708 | Yes |
| 60 | Lap3 | 8817 | -0.223 | -0.2597 | Yes |
| 61 | Usp18 | 8886 | -0.228 | -0.2528 | Yes |
| 62 | Psmb9 | 8958 | -0.232 | -0.2461 | Yes |
| 63 | Ccrl2 | 9089 | -0.239 | -0.2441 | Yes |
| 64 | Lgals3bp | 9171 | -0.245 | -0.2375 | Yes |
| 65 | Ifi27 | 9298 | -0.256 | -0.2341 | Yes |
| 66 | Tent5a | 9311 | -0.257 | -0.2208 | Yes |
| 67 | Isg20 | 9510 | -0.279 | -0.2225 | Yes |
| 68 | Trim21 | 9801 | -0.310 | -0.2303 | Yes |
| 69 | Nmi | 9886 | -0.319 | -0.2198 | Yes |
| 70 | Rsad2 | 9984 | -0.330 | -0.2098 | Yes |
| 71 | Stat2 | 10902 | -0.469 | -0.2632 | Yes |
| 72 | Il4ra | 10941 | -0.475 | -0.2401 | Yes |
| 73 | Pnpt1 | 10999 | -0.487 | -0.2179 | Yes |
| 74 | Sp110 | 11021 | -0.492 | -0.1923 | Yes |
| 75 | Trafd1 | 11142 | -0.533 | -0.1730 | Yes |
| 76 | Plscr1 | 11276 | -0.581 | -0.1522 | Yes |
| 77 | Ddx60 | 11359 | -0.618 | -0.1249 | Yes |
| 78 | Ifit2 | 11512 | -0.764 | -0.0955 | Yes |
| 79 | B2m | 11534 | -0.795 | -0.0531 | Yes |
| 80 | Uba7 | 11601 | -1.068 | 0.0007 | Yes |