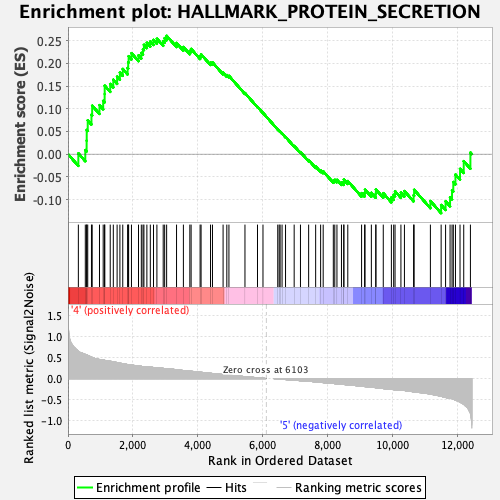
Profile of the Running ES Score & Positions of GeneSet Members on the Rank Ordered List
| Dataset | Mast.Mast_Pheno.cls #Group6_versus_Group8.Mast_Pheno.cls #Group6_versus_Group8_repos |
| Phenotype | Mast_Pheno.cls#Group6_versus_Group8_repos |
| Upregulated in class | 4 |
| GeneSet | HALLMARK_PROTEIN_SECRETION |
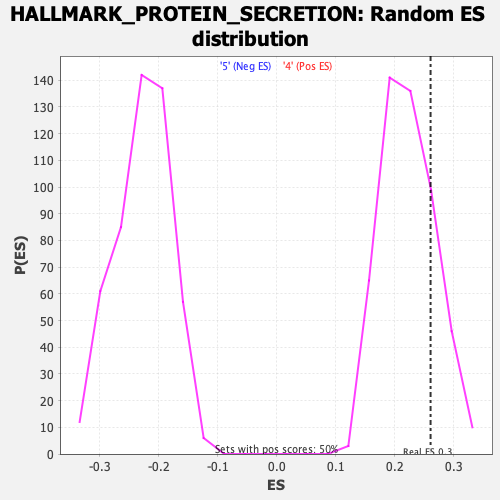
| Enrichment Score (ES) | 0.2605982 |
| Normalized Enrichment Score (NES) | 1.1720726 |
| Nominal p-value | 0.204 |
| FDR q-value | 0.604318 |
| FWER p-Value | 0.94 |
| SYMBOL | RANK IN GENE LIST | RANK METRIC SCORE | RUNNING ES | CORE ENRICHMENT | |
|---|---|---|---|---|---|
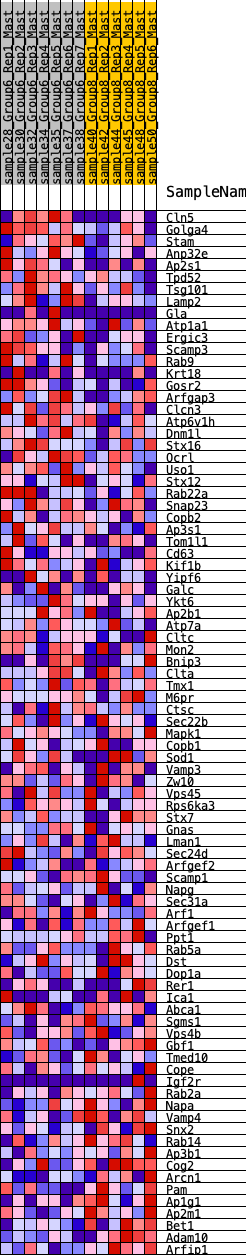
| 1 | Cln5 | 319 | 0.646 | 0.0017 | Yes |
| 2 | Golga4 | 533 | 0.575 | 0.0090 | Yes |
| 3 | Stam | 574 | 0.561 | 0.0297 | Yes |
| 4 | Anp32e | 577 | 0.560 | 0.0534 | Yes |
| 5 | Ap2s1 | 608 | 0.552 | 0.0745 | Yes |
| 6 | Tpd52 | 723 | 0.510 | 0.0870 | Yes |
| 7 | Tsg101 | 745 | 0.504 | 0.1068 | Yes |
| 8 | Lamp2 | 970 | 0.454 | 0.1080 | Yes |
| 9 | Gla | 1084 | 0.438 | 0.1175 | Yes |
| 10 | Atp1a1 | 1129 | 0.434 | 0.1324 | Yes |
| 11 | Ergic3 | 1131 | 0.433 | 0.1508 | Yes |
| 12 | Scamp3 | 1301 | 0.411 | 0.1546 | Yes |
| 13 | Rab9 | 1396 | 0.401 | 0.1641 | Yes |
| 14 | Krt18 | 1513 | 0.381 | 0.1709 | Yes |
| 15 | Gosr2 | 1599 | 0.366 | 0.1797 | Yes |
| 16 | Arfgap3 | 1687 | 0.353 | 0.1877 | Yes |
| 17 | Clcn3 | 1837 | 0.334 | 0.1899 | Yes |
| 18 | Atp6v1h | 1855 | 0.331 | 0.2026 | Yes |
| 19 | Dnm1l | 1868 | 0.330 | 0.2157 | Yes |
| 20 | Stx16 | 1955 | 0.321 | 0.2224 | Yes |
| 21 | Ocrl | 2172 | 0.297 | 0.2176 | Yes |
| 22 | Uso1 | 2259 | 0.290 | 0.2230 | Yes |
| 23 | Stx12 | 2310 | 0.285 | 0.2311 | Yes |
| 24 | Rab22a | 2339 | 0.283 | 0.2409 | Yes |
| 25 | Snap23 | 2430 | 0.276 | 0.2454 | Yes |
| 26 | Copb2 | 2536 | 0.268 | 0.2484 | Yes |
| 27 | Ap3s1 | 2634 | 0.263 | 0.2517 | Yes |
| 28 | Tom1l1 | 2739 | 0.258 | 0.2543 | Yes |
| 29 | Cd63 | 2933 | 0.242 | 0.2490 | Yes |
| 30 | Kif1b | 2978 | 0.238 | 0.2555 | Yes |
| 31 | Yipf6 | 3039 | 0.232 | 0.2606 | Yes |
| 32 | Galc | 3344 | 0.210 | 0.2449 | No |
| 33 | Ykt6 | 3555 | 0.191 | 0.2361 | No |
| 34 | Ap2b1 | 3754 | 0.176 | 0.2276 | No |
| 35 | Atp7a | 3793 | 0.173 | 0.2319 | No |
| 36 | Cltc | 4070 | 0.151 | 0.2159 | No |
| 37 | Mon2 | 4100 | 0.148 | 0.2199 | No |
| 38 | Bnip3 | 4391 | 0.125 | 0.2018 | No |
| 39 | Clta | 4451 | 0.120 | 0.2021 | No |
| 40 | Tmx1 | 4778 | 0.095 | 0.1798 | No |
| 41 | M6pr | 4893 | 0.087 | 0.1742 | No |
| 42 | Ctsc | 4958 | 0.081 | 0.1725 | No |
| 43 | Sec22b | 5452 | 0.046 | 0.1346 | No |
| 44 | Mapk1 | 5838 | 0.018 | 0.1042 | No |
| 45 | Copb1 | 6007 | 0.008 | 0.0909 | No |
| 46 | Sod1 | 6462 | -0.007 | 0.0545 | No |
| 47 | Vamp3 | 6505 | -0.010 | 0.0515 | No |
| 48 | Zw10 | 6535 | -0.012 | 0.0496 | No |
| 49 | Vps45 | 6595 | -0.015 | 0.0455 | No |
| 50 | Rps6ka3 | 6702 | -0.023 | 0.0379 | No |
| 51 | Stx7 | 6968 | -0.038 | 0.0181 | No |
| 52 | Gnas | 7162 | -0.050 | 0.0046 | No |
| 53 | Lman1 | 7414 | -0.063 | -0.0130 | No |
| 54 | Sec24d | 7630 | -0.078 | -0.0271 | No |
| 55 | Arfgef2 | 7783 | -0.089 | -0.0356 | No |
| 56 | Scamp1 | 7862 | -0.095 | -0.0379 | No |
| 57 | Napg | 8174 | -0.116 | -0.0581 | No |
| 58 | Sec31a | 8219 | -0.120 | -0.0566 | No |
| 59 | Arf1 | 8286 | -0.124 | -0.0566 | No |
| 60 | Arfgef1 | 8425 | -0.135 | -0.0621 | No |
| 61 | Ppt1 | 8497 | -0.140 | -0.0619 | No |
| 62 | Rab5a | 8499 | -0.140 | -0.0560 | No |
| 63 | Dst | 8620 | -0.149 | -0.0593 | No |
| 64 | Dop1a | 9045 | -0.181 | -0.0859 | No |
| 65 | Rer1 | 9138 | -0.190 | -0.0853 | No |
| 66 | Ica1 | 9151 | -0.190 | -0.0781 | No |
| 67 | Abca1 | 9346 | -0.204 | -0.0851 | No |
| 68 | Sgms1 | 9483 | -0.216 | -0.0869 | No |
| 69 | Vps4b | 9486 | -0.217 | -0.0778 | No |
| 70 | Gbf1 | 9713 | -0.237 | -0.0860 | No |
| 71 | Tmed10 | 9963 | -0.256 | -0.0953 | No |
| 72 | Cope | 10034 | -0.263 | -0.0897 | No |
| 73 | Igf2r | 10076 | -0.266 | -0.0817 | No |
| 74 | Rab2a | 10257 | -0.271 | -0.0847 | No |
| 75 | Napa | 10365 | -0.283 | -0.0813 | No |
| 76 | Vamp4 | 10647 | -0.314 | -0.0907 | No |
| 77 | Snx2 | 10664 | -0.315 | -0.0785 | No |
| 78 | Rab14 | 11165 | -0.369 | -0.1033 | No |
| 79 | Ap3b1 | 11496 | -0.421 | -0.1120 | No |
| 80 | Cog2 | 11633 | -0.450 | -0.1039 | No |
| 81 | Arcn1 | 11771 | -0.470 | -0.0949 | No |
| 82 | Pam | 11832 | -0.480 | -0.0793 | No |
| 83 | Ap1g1 | 11871 | -0.493 | -0.0614 | No |
| 84 | Ap2m1 | 11937 | -0.508 | -0.0450 | No |
| 85 | Bet1 | 12078 | -0.561 | -0.0324 | No |
| 86 | Adam10 | 12192 | -0.611 | -0.0155 | No |
| 87 | Arfip1 | 12398 | -0.834 | 0.0035 | No |