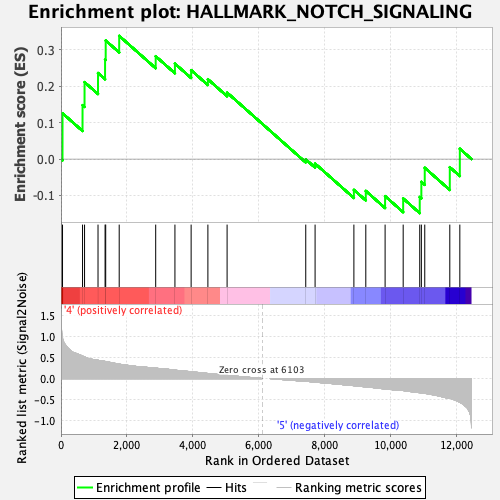
Profile of the Running ES Score & Positions of GeneSet Members on the Rank Ordered List
| Dataset | Mast.Mast_Pheno.cls #Group6_versus_Group8.Mast_Pheno.cls #Group6_versus_Group8_repos |
| Phenotype | Mast_Pheno.cls#Group6_versus_Group8_repos |
| Upregulated in class | 4 |
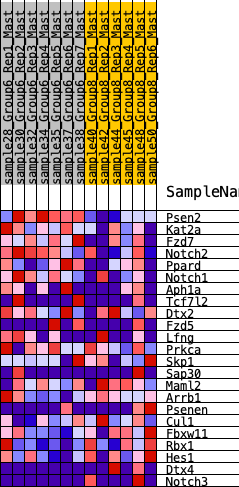
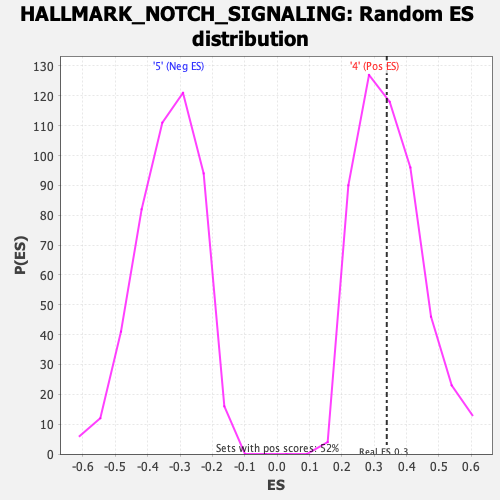
| GeneSet | HALLMARK_NOTCH_SIGNALING |
| Enrichment Score (ES) | 0.3387199 |
| Normalized Enrichment Score (NES) | 0.98052335 |
| Nominal p-value | 0.4738878 |
| FDR q-value | 0.78582585 |
| FWER p-Value | 1.0 |
| SYMBOL | RANK IN GENE LIST | RANK METRIC SCORE | RUNNING ES | CORE ENRICHMENT | |
|---|---|---|---|---|---|
| 1 | Psen2 | 46 | 0.977 | 0.1260 | Yes |
| 2 | Kat2a | 653 | 0.535 | 0.1482 | Yes |
| 3 | Fzd7 | 714 | 0.514 | 0.2116 | Yes |
| 4 | Notch2 | 1122 | 0.435 | 0.2366 | Yes |
| 5 | Ppard | 1336 | 0.408 | 0.2735 | Yes |
| 6 | Notch1 | 1355 | 0.406 | 0.3259 | Yes |
| 7 | Aph1a | 1764 | 0.344 | 0.3387 | Yes |
| 8 | Tcf7l2 | 2870 | 0.249 | 0.2827 | No |
| 9 | Dtx2 | 3453 | 0.200 | 0.2624 | No |
| 10 | Fzd5 | 3944 | 0.161 | 0.2444 | No |
| 11 | Lfng | 4452 | 0.120 | 0.2195 | No |
| 12 | Prkca | 5034 | 0.076 | 0.1828 | No |
| 13 | Skp1 | 7418 | -0.063 | -0.0007 | No |
| 14 | Sap30 | 7701 | -0.083 | -0.0123 | No |
| 15 | Maml2 | 8877 | -0.168 | -0.0846 | No |
| 16 | Arrb1 | 9238 | -0.197 | -0.0875 | No |
| 17 | Psenen | 9823 | -0.246 | -0.1019 | No |
| 18 | Cul1 | 10371 | -0.284 | -0.1082 | No |
| 19 | Fbxw11 | 10873 | -0.335 | -0.1042 | No |
| 20 | Rbx1 | 10922 | -0.343 | -0.0626 | No |
| 21 | Hes1 | 11025 | -0.353 | -0.0239 | No |
| 22 | Dtx4 | 11784 | -0.472 | -0.0223 | No |
| 23 | Notch3 | 12088 | -0.566 | 0.0284 | No |