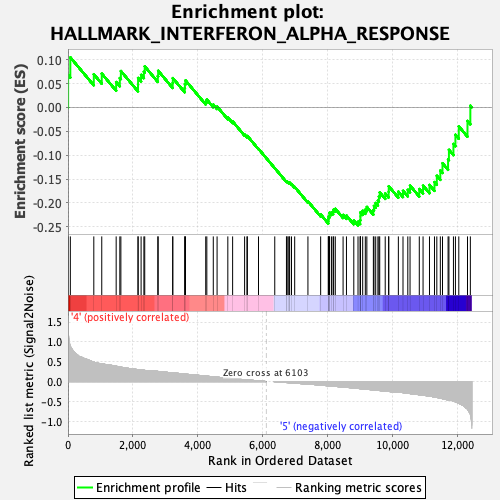
Profile of the Running ES Score & Positions of GeneSet Members on the Rank Ordered List
| Dataset | Mast.Mast_Pheno.cls #Group6_versus_Group8.Mast_Pheno.cls #Group6_versus_Group8_repos |
| Phenotype | Mast_Pheno.cls#Group6_versus_Group8_repos |
| Upregulated in class | 5 |
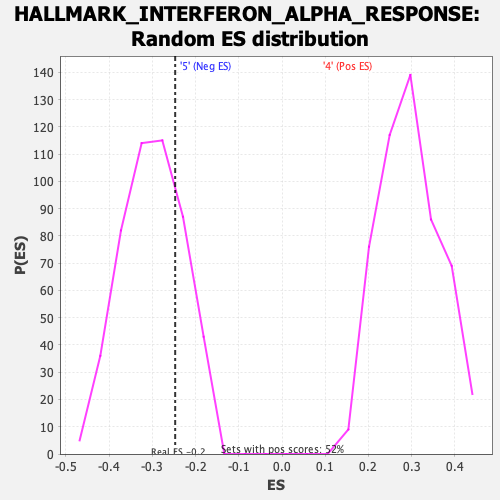
| GeneSet | HALLMARK_INTERFERON_ALPHA_RESPONSE |
| Enrichment Score (ES) | -0.24731925 |
| Normalized Enrichment Score (NES) | -0.82167685 |
| Nominal p-value | 0.7634855 |
| FDR q-value | 0.94902915 |
| FWER p-Value | 1.0 |
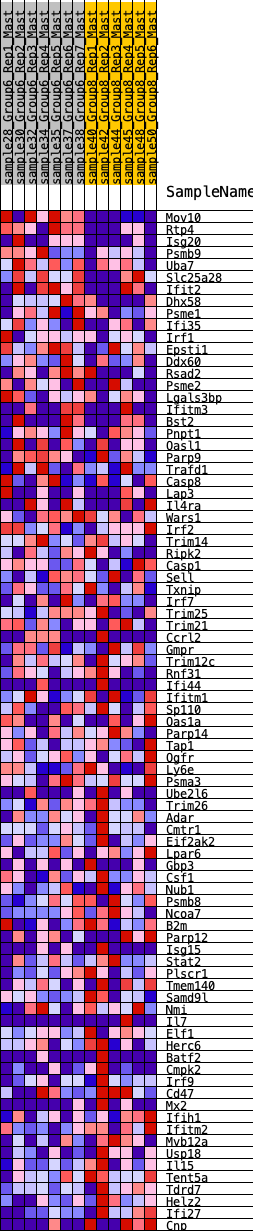
| SYMBOL | RANK IN GENE LIST | RANK METRIC SCORE | RUNNING ES | CORE ENRICHMENT | |
|---|---|---|---|---|---|
| 1 | Mov10 | 4 | 1.436 | 0.0678 | No |
| 2 | Rtp4 | 72 | 0.890 | 0.1046 | No |
| 3 | Isg20 | 795 | 0.489 | 0.0694 | No |
| 4 | Psmb9 | 1040 | 0.444 | 0.0707 | No |
| 5 | Uba7 | 1484 | 0.385 | 0.0531 | No |
| 6 | Slc25a28 | 1597 | 0.367 | 0.0615 | No |
| 7 | Ifit2 | 1629 | 0.362 | 0.0762 | No |
| 8 | Dhx58 | 2157 | 0.298 | 0.0477 | No |
| 9 | Psme1 | 2160 | 0.298 | 0.0616 | No |
| 10 | Ifi35 | 2252 | 0.291 | 0.0681 | No |
| 11 | Irf1 | 2338 | 0.283 | 0.0746 | No |
| 12 | Epsti1 | 2364 | 0.280 | 0.0859 | No |
| 13 | Ddx60 | 2767 | 0.255 | 0.0655 | No |
| 14 | Rsad2 | 2778 | 0.253 | 0.0767 | No |
| 15 | Psme2 | 3225 | 0.221 | 0.0511 | No |
| 16 | Lgals3bp | 3229 | 0.221 | 0.0613 | No |
| 17 | Ifitm3 | 3597 | 0.187 | 0.0405 | No |
| 18 | Bst2 | 3602 | 0.187 | 0.0490 | No |
| 19 | Pnpt1 | 3620 | 0.186 | 0.0565 | No |
| 20 | Oasl1 | 4243 | 0.137 | 0.0127 | No |
| 21 | Parp9 | 4277 | 0.135 | 0.0164 | No |
| 22 | Trafd1 | 4476 | 0.118 | 0.0060 | No |
| 23 | Casp8 | 4593 | 0.110 | 0.0018 | No |
| 24 | Lap3 | 4924 | 0.084 | -0.0209 | No |
| 25 | Il4ra | 5072 | 0.073 | -0.0293 | No |
| 26 | Wars1 | 5441 | 0.046 | -0.0569 | No |
| 27 | Irf2 | 5514 | 0.041 | -0.0608 | No |
| 28 | Trim14 | 5526 | 0.040 | -0.0598 | No |
| 29 | Ripk2 | 5869 | 0.016 | -0.0867 | No |
| 30 | Casp1 | 6370 | -0.002 | -0.1271 | No |
| 31 | Sell | 6730 | -0.024 | -0.1550 | No |
| 32 | Txnip | 6746 | -0.025 | -0.1550 | No |
| 33 | Irf7 | 6781 | -0.026 | -0.1565 | No |
| 34 | Trim25 | 6814 | -0.028 | -0.1578 | No |
| 35 | Trim21 | 6829 | -0.029 | -0.1575 | No |
| 36 | Ccrl2 | 6886 | -0.032 | -0.1605 | No |
| 37 | Gmpr | 6984 | -0.039 | -0.1665 | No |
| 38 | Trim12c | 7392 | -0.062 | -0.1965 | No |
| 39 | Rnf31 | 7784 | -0.089 | -0.2239 | No |
| 40 | Ifi44 | 8020 | -0.106 | -0.2379 | No |
| 41 | Ifitm1 | 8023 | -0.106 | -0.2330 | No |
| 42 | Sp110 | 8027 | -0.107 | -0.2282 | No |
| 43 | Oas1a | 8058 | -0.108 | -0.2255 | No |
| 44 | Parp14 | 8059 | -0.108 | -0.2203 | No |
| 45 | Tap1 | 8120 | -0.112 | -0.2199 | No |
| 46 | Ogfr | 8168 | -0.115 | -0.2182 | No |
| 47 | Ly6e | 8184 | -0.117 | -0.2139 | No |
| 48 | Psma3 | 8235 | -0.121 | -0.2122 | No |
| 49 | Ube2l6 | 8475 | -0.138 | -0.2250 | No |
| 50 | Trim26 | 8579 | -0.146 | -0.2264 | No |
| 51 | Adar | 8805 | -0.162 | -0.2369 | No |
| 52 | Cmtr1 | 8935 | -0.172 | -0.2391 | Yes |
| 53 | Eif2ak2 | 9000 | -0.178 | -0.2359 | Yes |
| 54 | Lpar6 | 9009 | -0.178 | -0.2280 | Yes |
| 55 | Gbp3 | 9010 | -0.178 | -0.2196 | Yes |
| 56 | Csf1 | 9079 | -0.184 | -0.2163 | Yes |
| 57 | Nub1 | 9160 | -0.191 | -0.2137 | Yes |
| 58 | Psmb8 | 9207 | -0.194 | -0.2083 | Yes |
| 59 | Ncoa7 | 9408 | -0.209 | -0.2145 | Yes |
| 60 | B2m | 9427 | -0.210 | -0.2060 | Yes |
| 61 | Parp12 | 9480 | -0.216 | -0.2000 | Yes |
| 62 | Isg15 | 9548 | -0.221 | -0.1949 | Yes |
| 63 | Stat2 | 9579 | -0.224 | -0.1867 | Yes |
| 64 | Plscr1 | 9604 | -0.226 | -0.1779 | Yes |
| 65 | Tmem140 | 9773 | -0.242 | -0.1800 | Yes |
| 66 | Samd9l | 9879 | -0.249 | -0.1767 | Yes |
| 67 | Nmi | 9882 | -0.249 | -0.1650 | Yes |
| 68 | Il7 | 10178 | -0.267 | -0.1762 | Yes |
| 69 | Elf1 | 10321 | -0.279 | -0.1745 | Yes |
| 70 | Herc6 | 10469 | -0.295 | -0.1724 | Yes |
| 71 | Batf2 | 10538 | -0.302 | -0.1635 | Yes |
| 72 | Cmpk2 | 10823 | -0.333 | -0.1707 | Yes |
| 73 | Irf9 | 10939 | -0.346 | -0.1636 | Yes |
| 74 | Cd47 | 11137 | -0.365 | -0.1622 | Yes |
| 75 | Mx2 | 11291 | -0.388 | -0.1562 | Yes |
| 76 | Ifih1 | 11363 | -0.399 | -0.1430 | Yes |
| 77 | Ifitm2 | 11471 | -0.416 | -0.1319 | Yes |
| 78 | Mvb12a | 11538 | -0.431 | -0.1168 | Yes |
| 79 | Usp18 | 11710 | -0.461 | -0.1088 | Yes |
| 80 | Il15 | 11736 | -0.465 | -0.0887 | Yes |
| 81 | Tent5a | 11875 | -0.494 | -0.0765 | Yes |
| 82 | Tdrd7 | 11936 | -0.508 | -0.0572 | Yes |
| 83 | Helz2 | 12040 | -0.545 | -0.0396 | Yes |
| 84 | Ifi27 | 12308 | -0.694 | -0.0283 | Yes |
| 85 | Cnp | 12396 | -0.821 | 0.0036 | Yes |