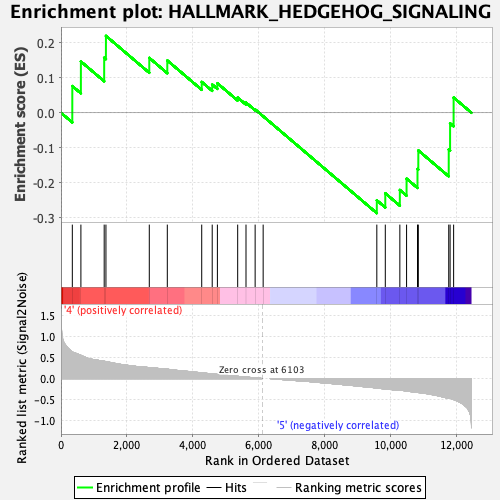
Profile of the Running ES Score & Positions of GeneSet Members on the Rank Ordered List
| Dataset | Mast.Mast_Pheno.cls #Group6_versus_Group8.Mast_Pheno.cls #Group6_versus_Group8_repos |
| Phenotype | Mast_Pheno.cls#Group6_versus_Group8_repos |
| Upregulated in class | 5 |
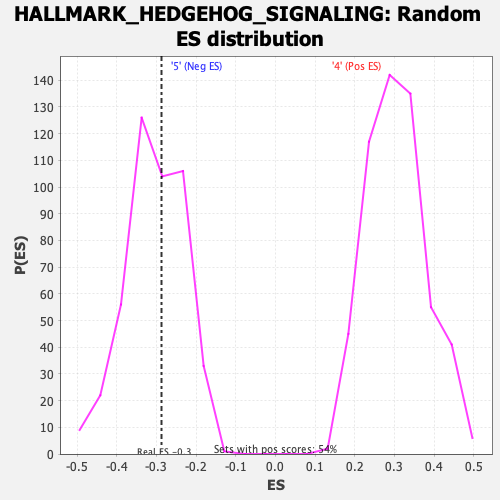
| GeneSet | HALLMARK_HEDGEHOG_SIGNALING |
| Enrichment Score (ES) | -0.2872562 |
| Normalized Enrichment Score (NES) | -0.9441143 |
| Nominal p-value | 0.5645514 |
| FDR q-value | 1.0 |
| FWER p-Value | 0.999 |
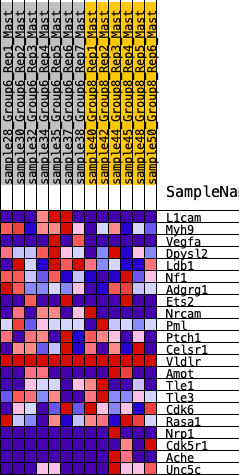
| SYMBOL | RANK IN GENE LIST | RANK METRIC SCORE | RUNNING ES | CORE ENRICHMENT | |
|---|---|---|---|---|---|
| 1 | L1cam | 343 | 0.631 | 0.0765 | No |
| 2 | Myh9 | 603 | 0.553 | 0.1469 | No |
| 3 | Vegfa | 1309 | 0.410 | 0.1577 | No |
| 4 | Dpysl2 | 1362 | 0.404 | 0.2201 | No |
| 5 | Ldb1 | 2676 | 0.259 | 0.1571 | No |
| 6 | Nf1 | 3222 | 0.221 | 0.1497 | No |
| 7 | Adgrg1 | 4265 | 0.136 | 0.0883 | No |
| 8 | Ets2 | 4583 | 0.110 | 0.0809 | No |
| 9 | Nrcam | 4740 | 0.098 | 0.0845 | No |
| 10 | Pml | 5355 | 0.052 | 0.0436 | No |
| 11 | Ptch1 | 5607 | 0.035 | 0.0292 | No |
| 12 | Celsr1 | 5884 | 0.015 | 0.0095 | No |
| 13 | Vldlr | 6127 | 0.000 | -0.0100 | No |
| 14 | Amot | 9572 | -0.223 | -0.2505 | Yes |
| 15 | Tle1 | 9829 | -0.247 | -0.2304 | Yes |
| 16 | Tle3 | 10270 | -0.272 | -0.2210 | Yes |
| 17 | Cdk6 | 10474 | -0.295 | -0.1886 | Yes |
| 18 | Rasa1 | 10805 | -0.330 | -0.1608 | Yes |
| 19 | Nrp1 | 10830 | -0.333 | -0.1078 | Yes |
| 20 | Cdk5r1 | 11752 | -0.466 | -0.1051 | Yes |
| 21 | Ache | 11793 | -0.474 | -0.0302 | Yes |
| 22 | Unc5c | 11900 | -0.499 | 0.0436 | Yes |