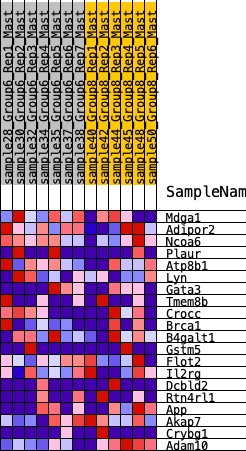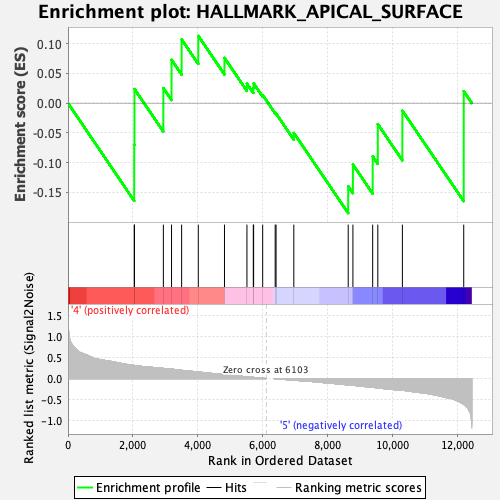
Profile of the Running ES Score & Positions of GeneSet Members on the Rank Ordered List
| Dataset | Mast.Mast_Pheno.cls #Group6_versus_Group8.Mast_Pheno.cls #Group6_versus_Group8_repos |
| Phenotype | Mast_Pheno.cls#Group6_versus_Group8_repos |
| Upregulated in class | 5 |
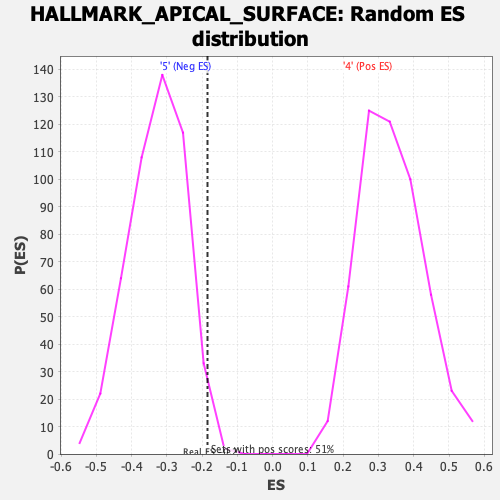
| GeneSet | HALLMARK_APICAL_SURFACE |
| Enrichment Score (ES) | -0.1849147 |
| Normalized Enrichment Score (NES) | -0.5601693 |
| Nominal p-value | 0.98155737 |
| FDR q-value | 0.99446326 |
| FWER p-Value | 1.0 |
| SYMBOL | RANK IN GENE LIST | RANK METRIC SCORE | RUNNING ES | CORE ENRICHMENT | |
|---|---|---|---|---|---|
| 1 | Mdga1 | 2040 | 0.312 | -0.0698 | No |
| 2 | Adipor2 | 2048 | 0.311 | 0.0237 | No |
| 3 | Ncoa6 | 2938 | 0.242 | 0.0252 | No |
| 4 | Plaur | 3190 | 0.224 | 0.0728 | No |
| 5 | Atp8b1 | 3501 | 0.196 | 0.1070 | No |
| 6 | Lyn | 4014 | 0.156 | 0.1130 | No |
| 7 | Gata3 | 4821 | 0.092 | 0.0760 | No |
| 8 | Tmem8b | 5513 | 0.041 | 0.0328 | No |
| 9 | Crocc | 5709 | 0.028 | 0.0256 | No |
| 10 | Brca1 | 5719 | 0.027 | 0.0332 | No |
| 11 | B4galt1 | 5998 | 0.009 | 0.0136 | No |
| 12 | Gstm5 | 6383 | -0.003 | -0.0165 | No |
| 13 | Flot2 | 6410 | -0.004 | -0.0175 | No |
| 14 | Il2rg | 6957 | -0.038 | -0.0501 | No |
| 15 | Dcbld2 | 8633 | -0.149 | -0.1398 | Yes |
| 16 | Rtn4rl1 | 8778 | -0.159 | -0.1031 | Yes |
| 17 | App | 9387 | -0.207 | -0.0894 | Yes |
| 18 | Akap7 | 9545 | -0.220 | -0.0354 | Yes |
| 19 | Crybg1 | 10302 | -0.276 | -0.0127 | Yes |
| 20 | Adam10 | 12192 | -0.611 | 0.0200 | Yes |