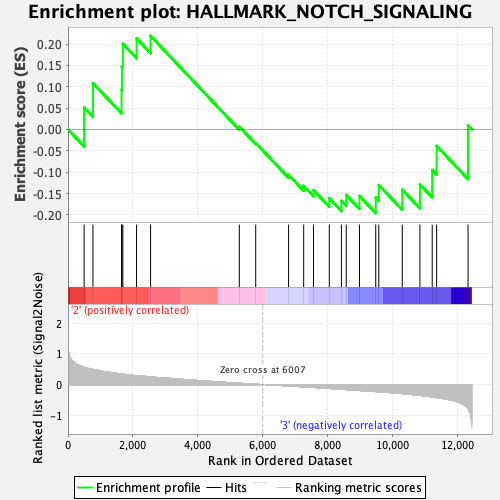
Profile of the Running ES Score & Positions of GeneSet Members on the Rank Ordered List
| Dataset | Mast.Mast_Pheno.cls #Group3_versus_Group4.Mast_Pheno.cls #Group3_versus_Group4_repos |
| Phenotype | Mast_Pheno.cls#Group3_versus_Group4_repos |
| Upregulated in class | 2 |
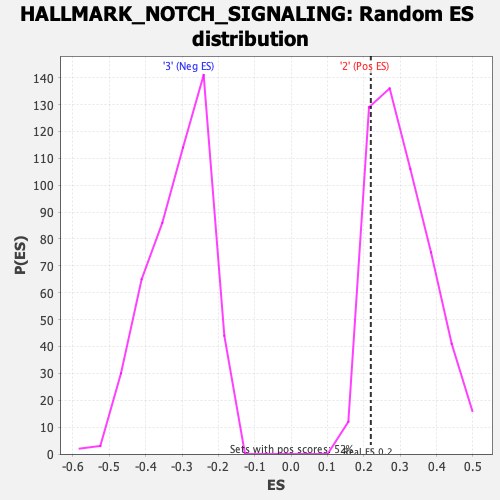
| GeneSet | HALLMARK_NOTCH_SIGNALING |
| Enrichment Score (ES) | 0.21915567 |
| Normalized Enrichment Score (NES) | 0.7173665 |
| Nominal p-value | 0.85048544 |
| FDR q-value | 1.0 |
| FWER p-Value | 1.0 |
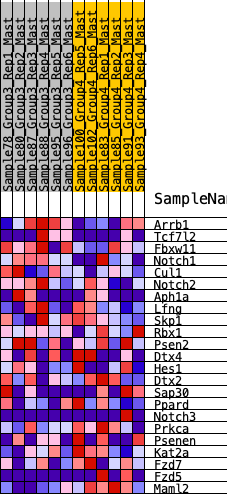
| SYMBOL | RANK IN GENE LIST | RANK METRIC SCORE | RUNNING ES | CORE ENRICHMENT | |
|---|---|---|---|---|---|
| 1 | Arrb1 | 497 | 0.570 | 0.0514 | Yes |
| 2 | Tcf7l2 | 769 | 0.492 | 0.1085 | Yes |
| 3 | Fbxw11 | 1650 | 0.347 | 0.0932 | Yes |
| 4 | Notch1 | 1660 | 0.346 | 0.1479 | Yes |
| 5 | Cul1 | 1690 | 0.343 | 0.2005 | Yes |
| 6 | Notch2 | 2112 | 0.292 | 0.2134 | Yes |
| 7 | Aph1a | 2544 | 0.252 | 0.2192 | Yes |
| 8 | Lfng | 5278 | 0.045 | 0.0063 | No |
| 9 | Skp1 | 5783 | 0.014 | -0.0319 | No |
| 10 | Rbx1 | 6796 | -0.044 | -0.1064 | No |
| 11 | Psen2 | 7261 | -0.072 | -0.1323 | No |
| 12 | Dtx4 | 7563 | -0.090 | -0.1420 | No |
| 13 | Hes1 | 8050 | -0.124 | -0.1612 | No |
| 14 | Dtx2 | 8423 | -0.149 | -0.1673 | No |
| 15 | Sap30 | 8572 | -0.160 | -0.1535 | No |
| 16 | Ppard | 8980 | -0.190 | -0.1558 | No |
| 17 | Notch3 | 9481 | -0.226 | -0.1597 | No |
| 18 | Prkca | 9575 | -0.231 | -0.1301 | No |
| 19 | Psenen | 10298 | -0.294 | -0.1412 | No |
| 20 | Kat2a | 10843 | -0.350 | -0.1288 | No |
| 21 | Fzd7 | 11221 | -0.399 | -0.0952 | No |
| 22 | Fzd5 | 11358 | -0.422 | -0.0385 | No |
| 23 | Maml2 | 12325 | -0.784 | 0.0093 | No |