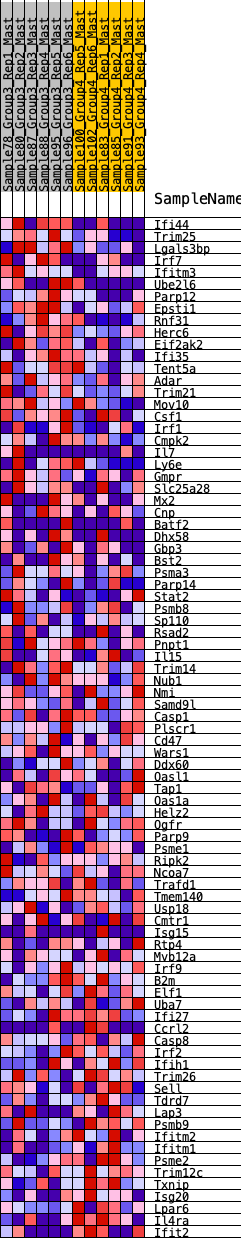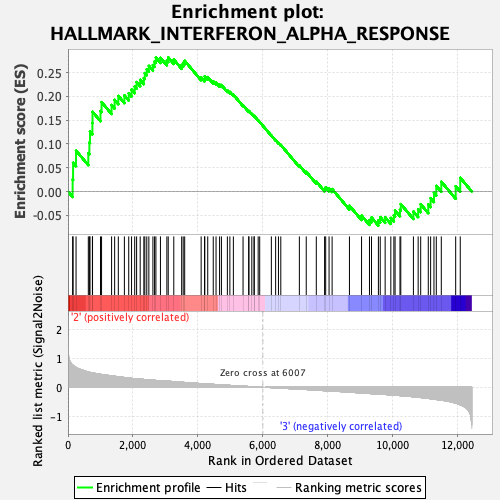
Profile of the Running ES Score & Positions of GeneSet Members on the Rank Ordered List
| Dataset | Mast.Mast_Pheno.cls #Group3_versus_Group4.Mast_Pheno.cls #Group3_versus_Group4_repos |
| Phenotype | Mast_Pheno.cls#Group3_versus_Group4_repos |
| Upregulated in class | 2 |
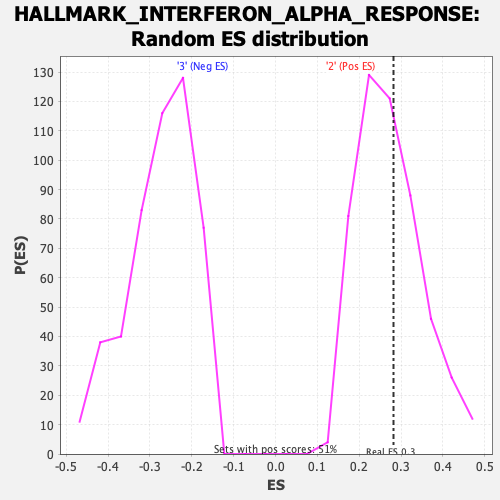
| GeneSet | HALLMARK_INTERFERON_ALPHA_RESPONSE |
| Enrichment Score (ES) | 0.2818318 |
| Normalized Enrichment Score (NES) | 1.032731 |
| Nominal p-value | 0.3984221 |
| FDR q-value | 0.6862737 |
| FWER p-Value | 1.0 |
| SYMBOL | RANK IN GENE LIST | RANK METRIC SCORE | RUNNING ES | CORE ENRICHMENT | |
|---|---|---|---|---|---|
| 1 | Ifi44 | 143 | 0.767 | 0.0253 | Yes |
| 2 | Trim25 | 157 | 0.755 | 0.0604 | Yes |
| 3 | Lgals3bp | 248 | 0.682 | 0.0859 | Yes |
| 4 | Irf7 | 626 | 0.528 | 0.0808 | Yes |
| 5 | Ifitm3 | 659 | 0.516 | 0.1030 | Yes |
| 6 | Ube2l6 | 678 | 0.512 | 0.1261 | Yes |
| 7 | Parp12 | 752 | 0.495 | 0.1440 | Yes |
| 8 | Epsti1 | 756 | 0.495 | 0.1675 | Yes |
| 9 | Rnf31 | 1001 | 0.449 | 0.1693 | Yes |
| 10 | Herc6 | 1034 | 0.440 | 0.1878 | Yes |
| 11 | Eif2ak2 | 1343 | 0.394 | 0.1818 | Yes |
| 12 | Ifi35 | 1437 | 0.381 | 0.1926 | Yes |
| 13 | Tent5a | 1550 | 0.361 | 0.2009 | Yes |
| 14 | Adar | 1737 | 0.337 | 0.2020 | Yes |
| 15 | Trim21 | 1871 | 0.319 | 0.2065 | Yes |
| 16 | Mov10 | 1958 | 0.307 | 0.2143 | Yes |
| 17 | Csf1 | 2055 | 0.297 | 0.2208 | Yes |
| 18 | Irf1 | 2114 | 0.291 | 0.2301 | Yes |
| 19 | Cmpk2 | 2224 | 0.279 | 0.2347 | Yes |
| 20 | Il7 | 2337 | 0.269 | 0.2385 | Yes |
| 21 | Ly6e | 2367 | 0.267 | 0.2490 | Yes |
| 22 | Gmpr | 2427 | 0.264 | 0.2569 | Yes |
| 23 | Slc25a28 | 2491 | 0.257 | 0.2641 | Yes |
| 24 | Mx2 | 2616 | 0.245 | 0.2658 | Yes |
| 25 | Cnp | 2667 | 0.239 | 0.2733 | Yes |
| 26 | Batf2 | 2708 | 0.235 | 0.2813 | Yes |
| 27 | Dhx58 | 2848 | 0.226 | 0.2809 | Yes |
| 28 | Gbp3 | 3046 | 0.212 | 0.2751 | Yes |
| 29 | Bst2 | 3088 | 0.208 | 0.2818 | Yes |
| 30 | Psma3 | 3259 | 0.194 | 0.2774 | No |
| 31 | Parp14 | 3502 | 0.173 | 0.2661 | No |
| 32 | Stat2 | 3549 | 0.169 | 0.2705 | No |
| 33 | Psmb8 | 3595 | 0.165 | 0.2748 | No |
| 34 | Sp110 | 4102 | 0.126 | 0.2399 | No |
| 35 | Rsad2 | 4207 | 0.118 | 0.2371 | No |
| 36 | Pnpt1 | 4214 | 0.117 | 0.2423 | No |
| 37 | Il15 | 4305 | 0.111 | 0.2403 | No |
| 38 | Trim14 | 4475 | 0.100 | 0.2314 | No |
| 39 | Nub1 | 4561 | 0.094 | 0.2291 | No |
| 40 | Nmi | 4670 | 0.086 | 0.2245 | No |
| 41 | Samd9l | 4727 | 0.081 | 0.2238 | No |
| 42 | Casp1 | 4910 | 0.069 | 0.2124 | No |
| 43 | Plscr1 | 4987 | 0.065 | 0.2094 | No |
| 44 | Cd47 | 5095 | 0.057 | 0.2035 | No |
| 45 | Wars1 | 5393 | 0.037 | 0.1812 | No |
| 46 | Ddx60 | 5567 | 0.026 | 0.1685 | No |
| 47 | Oasl1 | 5574 | 0.026 | 0.1693 | No |
| 48 | Tap1 | 5663 | 0.021 | 0.1631 | No |
| 49 | Oas1a | 5734 | 0.017 | 0.1583 | No |
| 50 | Helz2 | 5736 | 0.017 | 0.1590 | No |
| 51 | Ogfr | 5859 | 0.009 | 0.1496 | No |
| 52 | Parp9 | 5906 | 0.006 | 0.1462 | No |
| 53 | Psme1 | 6265 | -0.010 | 0.1177 | No |
| 54 | Ripk2 | 6397 | -0.019 | 0.1080 | No |
| 55 | Ncoa7 | 6484 | -0.025 | 0.1023 | No |
| 56 | Trafd1 | 6556 | -0.028 | 0.0978 | No |
| 57 | Tmem140 | 7128 | -0.064 | 0.0547 | No |
| 58 | Usp18 | 7340 | -0.076 | 0.0413 | No |
| 59 | Cmtr1 | 7650 | -0.097 | 0.0209 | No |
| 60 | Isg15 | 7905 | -0.115 | 0.0059 | No |
| 61 | Rtp4 | 7939 | -0.117 | 0.0089 | No |
| 62 | Mvb12a | 8043 | -0.124 | 0.0065 | No |
| 63 | Irf9 | 8137 | -0.130 | 0.0052 | No |
| 64 | B2m | 8671 | -0.169 | -0.0298 | No |
| 65 | Elf1 | 9044 | -0.195 | -0.0506 | No |
| 66 | Uba7 | 9288 | -0.214 | -0.0600 | No |
| 67 | Ifi27 | 9351 | -0.217 | -0.0546 | No |
| 68 | Ccrl2 | 9563 | -0.230 | -0.0606 | No |
| 69 | Casp8 | 9620 | -0.236 | -0.0538 | No |
| 70 | Irf2 | 9771 | -0.247 | -0.0541 | No |
| 71 | Ifih1 | 9946 | -0.263 | -0.0555 | No |
| 72 | Trim26 | 10040 | -0.270 | -0.0501 | No |
| 73 | Sell | 10077 | -0.273 | -0.0399 | No |
| 74 | Tdrd7 | 10228 | -0.286 | -0.0383 | No |
| 75 | Lap3 | 10253 | -0.288 | -0.0264 | No |
| 76 | Psmb9 | 10642 | -0.328 | -0.0421 | No |
| 77 | Ifitm2 | 10788 | -0.343 | -0.0373 | No |
| 78 | Ifitm1 | 10866 | -0.352 | -0.0266 | No |
| 79 | Psme2 | 11100 | -0.383 | -0.0271 | No |
| 80 | Trim12c | 11172 | -0.393 | -0.0140 | No |
| 81 | Txnip | 11275 | -0.407 | -0.0027 | No |
| 82 | Isg20 | 11347 | -0.421 | 0.0118 | No |
| 83 | Lpar6 | 11501 | -0.441 | 0.0206 | No |
| 84 | Il4ra | 11944 | -0.547 | 0.0111 | No |
| 85 | Ifit2 | 12085 | -0.605 | 0.0288 | No |