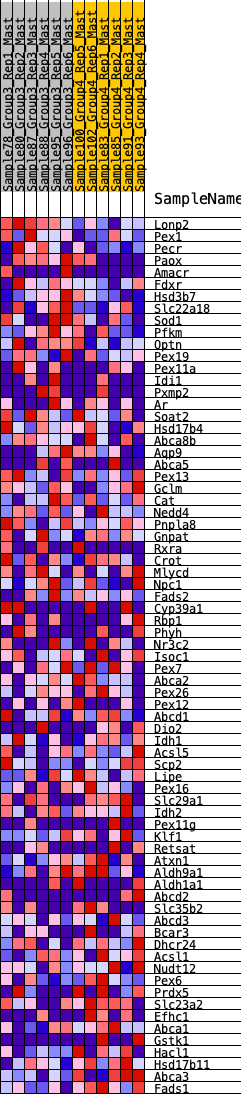
Profile of the Running ES Score & Positions of GeneSet Members on the Rank Ordered List
| Dataset | Mast.Mast_Pheno.cls #Group3_versus_Group4.Mast_Pheno.cls #Group3_versus_Group4_repos |
| Phenotype | Mast_Pheno.cls#Group3_versus_Group4_repos |
| Upregulated in class | 3 |
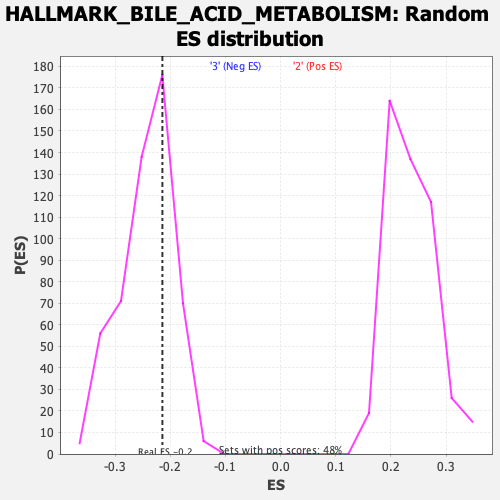
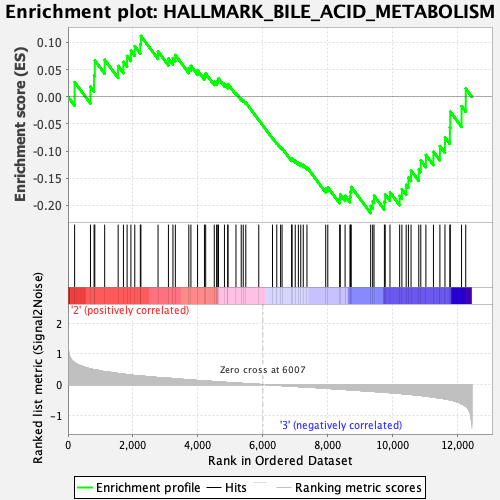
| GeneSet | HALLMARK_BILE_ACID_METABOLISM |
| Enrichment Score (ES) | -0.21414666 |
| Normalized Enrichment Score (NES) | -0.8815465 |
| Nominal p-value | 0.6954023 |
| FDR q-value | 1.0 |
| FWER p-Value | 1.0 |
| SYMBOL | RANK IN GENE LIST | RANK METRIC SCORE | RUNNING ES | CORE ENRICHMENT | |
|---|---|---|---|---|---|
| 1 | Lonp2 | 204 | 0.712 | 0.0270 | No |
| 2 | Pex1 | 692 | 0.509 | 0.0187 | No |
| 3 | Pecr | 804 | 0.484 | 0.0393 | No |
| 4 | Paox | 826 | 0.479 | 0.0669 | No |
| 5 | Amacr | 1130 | 0.421 | 0.0681 | No |
| 6 | Fdxr | 1545 | 0.361 | 0.0567 | No |
| 7 | Hsd3b7 | 1708 | 0.340 | 0.0643 | No |
| 8 | Slc22a18 | 1821 | 0.324 | 0.0751 | No |
| 9 | Sod1 | 1938 | 0.311 | 0.0847 | No |
| 10 | Pfkm | 2057 | 0.296 | 0.0933 | No |
| 11 | Optn | 2228 | 0.278 | 0.0965 | No |
| 12 | Pex19 | 2246 | 0.276 | 0.1120 | No |
| 13 | Pex11a | 2774 | 0.230 | 0.0835 | No |
| 14 | Idi1 | 3094 | 0.208 | 0.0704 | No |
| 15 | Pxmp2 | 3233 | 0.196 | 0.0712 | No |
| 16 | Ar | 3307 | 0.190 | 0.0769 | No |
| 17 | Soat2 | 3722 | 0.155 | 0.0529 | No |
| 18 | Hsd17b4 | 3787 | 0.150 | 0.0569 | No |
| 19 | Abca8b | 3992 | 0.135 | 0.0486 | No |
| 20 | Aqp9 | 4204 | 0.119 | 0.0388 | No |
| 21 | Abca5 | 4242 | 0.115 | 0.0428 | No |
| 22 | Pex13 | 4506 | 0.098 | 0.0276 | No |
| 23 | Gclm | 4578 | 0.093 | 0.0275 | No |
| 24 | Cat | 4615 | 0.090 | 0.0301 | No |
| 25 | Nedd4 | 4637 | 0.088 | 0.0338 | No |
| 26 | Pnpla8 | 4820 | 0.076 | 0.0237 | No |
| 27 | Gnpat | 4923 | 0.068 | 0.0196 | No |
| 28 | Rxra | 4928 | 0.068 | 0.0234 | No |
| 29 | Crot | 5175 | 0.051 | 0.0067 | No |
| 30 | Mlycd | 5337 | 0.041 | -0.0038 | No |
| 31 | Npc1 | 5399 | 0.037 | -0.0065 | No |
| 32 | Fads2 | 5478 | 0.033 | -0.0108 | No |
| 33 | Cyp39a1 | 5877 | 0.007 | -0.0425 | No |
| 34 | Rbp1 | 6300 | -0.012 | -0.0759 | No |
| 35 | Phyh | 6432 | -0.022 | -0.0851 | No |
| 36 | Nr3c2 | 6550 | -0.027 | -0.0929 | No |
| 37 | Isoc1 | 6595 | -0.031 | -0.0946 | No |
| 38 | Pex7 | 6888 | -0.050 | -0.1152 | No |
| 39 | Abca2 | 6904 | -0.051 | -0.1133 | No |
| 40 | Pex26 | 7001 | -0.056 | -0.1176 | No |
| 41 | Pex12 | 7098 | -0.063 | -0.1216 | No |
| 42 | Abcd1 | 7171 | -0.067 | -0.1233 | No |
| 43 | Dio2 | 7248 | -0.071 | -0.1251 | No |
| 44 | Idh1 | 7362 | -0.078 | -0.1295 | No |
| 45 | Acsl5 | 7940 | -0.117 | -0.1691 | No |
| 46 | Scp2 | 8004 | -0.121 | -0.1667 | No |
| 47 | Lipe | 8370 | -0.146 | -0.1874 | No |
| 48 | Pex16 | 8388 | -0.147 | -0.1798 | No |
| 49 | Slc29a1 | 8537 | -0.157 | -0.1821 | No |
| 50 | Idh2 | 8688 | -0.170 | -0.1839 | No |
| 51 | Pex11g | 8702 | -0.171 | -0.1745 | No |
| 52 | Klf1 | 8726 | -0.173 | -0.1658 | No |
| 53 | Retsat | 9325 | -0.216 | -0.2009 | Yes |
| 54 | Atxn1 | 9387 | -0.220 | -0.1924 | Yes |
| 55 | Aldh9a1 | 9428 | -0.223 | -0.1820 | Yes |
| 56 | Aldh1a1 | 9748 | -0.245 | -0.1928 | Yes |
| 57 | Abcd2 | 9773 | -0.247 | -0.1797 | Yes |
| 58 | Slc35b2 | 9920 | -0.260 | -0.1756 | Yes |
| 59 | Abcd3 | 10218 | -0.285 | -0.1822 | Yes |
| 60 | Bcar3 | 10287 | -0.292 | -0.1699 | Yes |
| 61 | Dhcr24 | 10419 | -0.302 | -0.1620 | Yes |
| 62 | Acsl1 | 10488 | -0.310 | -0.1486 | Yes |
| 63 | Nudt12 | 10569 | -0.318 | -0.1357 | Yes |
| 64 | Pex6 | 10807 | -0.346 | -0.1337 | Yes |
| 65 | Prdx5 | 10869 | -0.353 | -0.1171 | Yes |
| 66 | Slc23a2 | 11026 | -0.372 | -0.1070 | Yes |
| 67 | Efhc1 | 11259 | -0.405 | -0.1010 | Yes |
| 68 | Abca1 | 11458 | -0.433 | -0.0906 | Yes |
| 69 | Gstk1 | 11614 | -0.465 | -0.0747 | Yes |
| 70 | Hacl1 | 11765 | -0.494 | -0.0567 | Yes |
| 71 | Hsd17b11 | 11777 | -0.495 | -0.0274 | Yes |
| 72 | Abca3 | 12125 | -0.625 | -0.0173 | Yes |
| 73 | Fads1 | 12254 | -0.700 | 0.0151 | Yes |