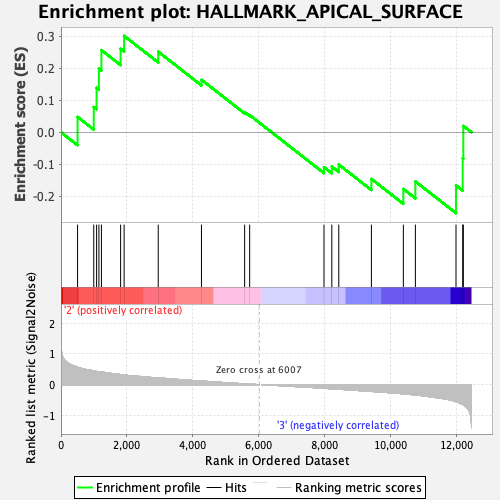
Profile of the Running ES Score & Positions of GeneSet Members on the Rank Ordered List
| Dataset | Mast.Mast_Pheno.cls #Group3_versus_Group4.Mast_Pheno.cls #Group3_versus_Group4_repos |
| Phenotype | Mast_Pheno.cls#Group3_versus_Group4_repos |
| Upregulated in class | 2 |
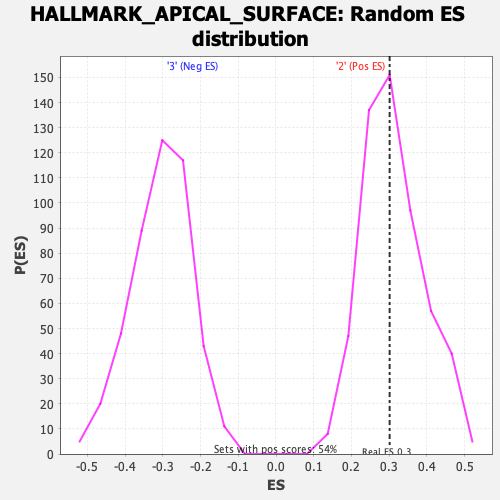
| GeneSet | HALLMARK_APICAL_SURFACE |
| Enrichment Score (ES) | 0.30121046 |
| Normalized Enrichment Score (NES) | 0.96483624 |
| Nominal p-value | 0.49261993 |
| FDR q-value | 0.77019584 |
| FWER p-Value | 1.0 |
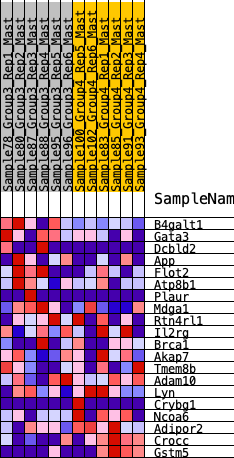
| SYMBOL | RANK IN GENE LIST | RANK METRIC SCORE | RUNNING ES | CORE ENRICHMENT | |
|---|---|---|---|---|---|
| 1 | B4galt1 | 502 | 0.567 | 0.0479 | Yes |
| 2 | Gata3 | 993 | 0.452 | 0.0790 | Yes |
| 3 | Dcbld2 | 1079 | 0.429 | 0.1390 | Yes |
| 4 | App | 1149 | 0.419 | 0.1988 | Yes |
| 5 | Flot2 | 1225 | 0.410 | 0.2567 | Yes |
| 6 | Atp8b1 | 1807 | 0.326 | 0.2608 | Yes |
| 7 | Plaur | 1913 | 0.313 | 0.3012 | Yes |
| 8 | Mdga1 | 2947 | 0.216 | 0.2517 | No |
| 9 | Rtn4rl1 | 4257 | 0.114 | 0.1641 | No |
| 10 | Il2rg | 5566 | 0.027 | 0.0630 | No |
| 11 | Brca1 | 5718 | 0.018 | 0.0536 | No |
| 12 | Akap7 | 7971 | -0.119 | -0.1091 | No |
| 13 | Tmem8b | 8208 | -0.135 | -0.1071 | No |
| 14 | Adam10 | 8419 | -0.148 | -0.1009 | No |
| 15 | Lyn | 9408 | -0.222 | -0.1458 | No |
| 16 | Crybg1 | 10376 | -0.298 | -0.1771 | No |
| 17 | Ncoa6 | 10741 | -0.338 | -0.1536 | No |
| 18 | Adipor2 | 11972 | -0.556 | -0.1659 | No |
| 19 | Crocc | 12175 | -0.646 | -0.0815 | No |
| 20 | Gstm5 | 12194 | -0.659 | 0.0199 | No |