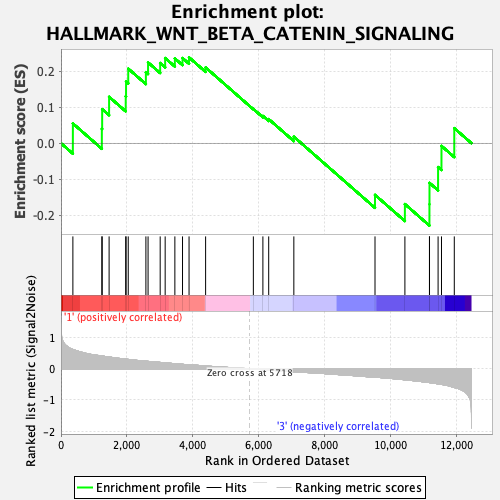
Profile of the Running ES Score & Positions of GeneSet Members on the Rank Ordered List
| Dataset | Mast.Mast_Pheno.cls #Group2_versus_Group4.Mast_Pheno.cls #Group2_versus_Group4_repos |
| Phenotype | Mast_Pheno.cls#Group2_versus_Group4_repos |
| Upregulated in class | 1 |
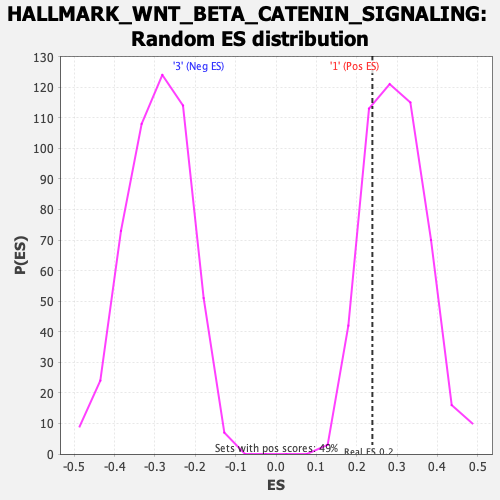
| GeneSet | HALLMARK_WNT_BETA_CATENIN_SIGNALING |
| Enrichment Score (ES) | 0.23891868 |
| Normalized Enrichment Score (NES) | 0.8138175 |
| Nominal p-value | 0.7632653 |
| FDR q-value | 1.0 |
| FWER p-Value | 1.0 |
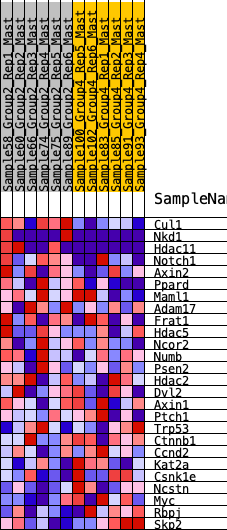
| SYMBOL | RANK IN GENE LIST | RANK METRIC SCORE | RUNNING ES | CORE ENRICHMENT | |
|---|---|---|---|---|---|
| 1 | Cul1 | 360 | 0.623 | 0.0551 | Yes |
| 2 | Nkd1 | 1238 | 0.412 | 0.0401 | Yes |
| 3 | Hdac11 | 1248 | 0.410 | 0.0948 | Yes |
| 4 | Notch1 | 1458 | 0.379 | 0.1292 | Yes |
| 5 | Axin2 | 1962 | 0.311 | 0.1308 | Yes |
| 6 | Ppard | 1972 | 0.309 | 0.1718 | Yes |
| 7 | Maml1 | 2038 | 0.303 | 0.2076 | Yes |
| 8 | Adam17 | 2573 | 0.246 | 0.1978 | Yes |
| 9 | Frat1 | 2639 | 0.239 | 0.2249 | Yes |
| 10 | Hdac5 | 3006 | 0.206 | 0.2233 | Yes |
| 11 | Ncor2 | 3157 | 0.191 | 0.2371 | Yes |
| 12 | Numb | 3451 | 0.167 | 0.2361 | Yes |
| 13 | Psen2 | 3683 | 0.145 | 0.2372 | Yes |
| 14 | Hdac2 | 3881 | 0.130 | 0.2389 | Yes |
| 15 | Dvl2 | 4383 | 0.091 | 0.2109 | No |
| 16 | Axin1 | 5830 | -0.007 | 0.0954 | No |
| 17 | Ptch1 | 6119 | -0.028 | 0.0759 | No |
| 18 | Trp53 | 6295 | -0.039 | 0.0672 | No |
| 19 | Ctnnb1 | 7057 | -0.091 | 0.0182 | No |
| 20 | Ccnd2 | 9517 | -0.267 | -0.1437 | No |
| 21 | Kat2a | 10423 | -0.349 | -0.1694 | No |
| 22 | Csnk1e | 11167 | -0.440 | -0.1698 | No |
| 23 | Ncstn | 11169 | -0.440 | -0.1104 | No |
| 24 | Myc | 11429 | -0.480 | -0.0664 | No |
| 25 | Rbpj | 11532 | -0.497 | -0.0074 | No |
| 26 | Skp2 | 11920 | -0.596 | 0.0420 | No |