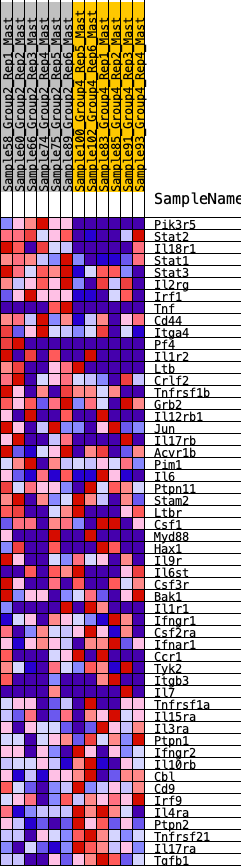
Profile of the Running ES Score & Positions of GeneSet Members on the Rank Ordered List
| Dataset | Mast.Mast_Pheno.cls #Group2_versus_Group4.Mast_Pheno.cls #Group2_versus_Group4_repos |
| Phenotype | Mast_Pheno.cls#Group2_versus_Group4_repos |
| Upregulated in class | 1 |
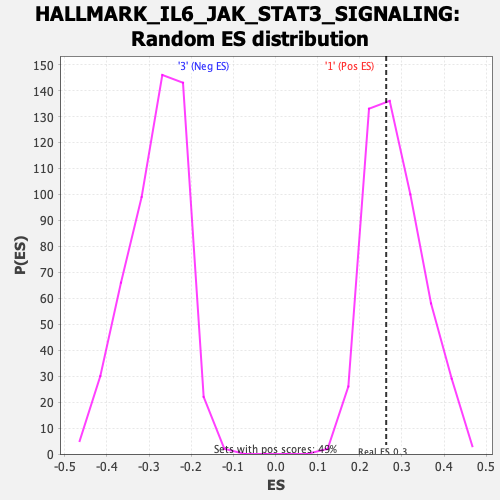
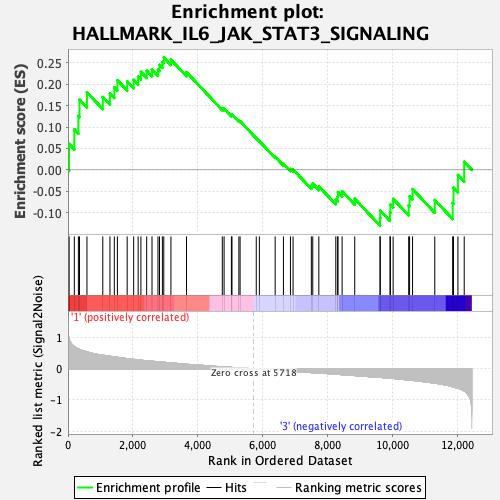
| GeneSet | HALLMARK_IL6_JAK_STAT3_SIGNALING |
| Enrichment Score (ES) | 0.26256564 |
| Normalized Enrichment Score (NES) | 0.9297366 |
| Nominal p-value | 0.5626283 |
| FDR q-value | 1.0 |
| FWER p-Value | 1.0 |
| SYMBOL | RANK IN GENE LIST | RANK METRIC SCORE | RUNNING ES | CORE ENRICHMENT | |
|---|---|---|---|---|---|
| 1 | Pik3r5 | 34 | 0.973 | 0.0606 | Yes |
| 2 | Stat2 | 195 | 0.718 | 0.0944 | Yes |
| 3 | Il18r1 | 320 | 0.638 | 0.1259 | Yes |
| 4 | Stat1 | 354 | 0.625 | 0.1640 | Yes |
| 5 | Stat3 | 584 | 0.547 | 0.1811 | Yes |
| 6 | Il2rg | 1072 | 0.436 | 0.1701 | Yes |
| 7 | Irf1 | 1292 | 0.404 | 0.1787 | Yes |
| 8 | Tnf | 1427 | 0.383 | 0.1929 | Yes |
| 9 | Cd44 | 1522 | 0.371 | 0.2095 | Yes |
| 10 | Itga4 | 1823 | 0.326 | 0.2065 | Yes |
| 11 | Pf4 | 2023 | 0.304 | 0.2102 | Yes |
| 12 | Il1r2 | 2161 | 0.285 | 0.2177 | Yes |
| 13 | Ltb | 2246 | 0.277 | 0.2289 | Yes |
| 14 | Crlf2 | 2424 | 0.260 | 0.2315 | Yes |
| 15 | Tnfrsf1b | 2588 | 0.244 | 0.2343 | Yes |
| 16 | Grb2 | 2772 | 0.228 | 0.2344 | Yes |
| 17 | Il12rb1 | 2819 | 0.224 | 0.2452 | Yes |
| 18 | Jun | 2908 | 0.216 | 0.2522 | Yes |
| 19 | Il17rb | 2951 | 0.212 | 0.2626 | Yes |
| 20 | Acvr1b | 3171 | 0.190 | 0.2573 | No |
| 21 | Pim1 | 3651 | 0.148 | 0.2283 | No |
| 22 | Il6 | 4754 | 0.064 | 0.1435 | No |
| 23 | Ptpn11 | 4809 | 0.061 | 0.1431 | No |
| 24 | Stam2 | 5035 | 0.047 | 0.1280 | No |
| 25 | Ltbr | 5052 | 0.046 | 0.1297 | No |
| 26 | Csf1 | 5264 | 0.032 | 0.1147 | No |
| 27 | Myd88 | 5302 | 0.030 | 0.1137 | No |
| 28 | Hax1 | 5800 | -0.004 | 0.0738 | No |
| 29 | Il9r | 5896 | -0.011 | 0.0669 | No |
| 30 | Il6st | 6382 | -0.046 | 0.0307 | No |
| 31 | Csf3r | 6637 | -0.062 | 0.0143 | No |
| 32 | Bak1 | 6853 | -0.077 | 0.0020 | No |
| 33 | Il1r1 | 6934 | -0.082 | 0.0009 | No |
| 34 | Ifngr1 | 7497 | -0.119 | -0.0367 | No |
| 35 | Csf2ra | 7541 | -0.121 | -0.0323 | No |
| 36 | Ifnar1 | 7728 | -0.134 | -0.0386 | No |
| 37 | Ccr1 | 8251 | -0.171 | -0.0696 | No |
| 38 | Tyk2 | 8308 | -0.176 | -0.0627 | No |
| 39 | Itgb3 | 8317 | -0.176 | -0.0518 | No |
| 40 | Il7 | 8445 | -0.185 | -0.0500 | No |
| 41 | Tnfrsf1a | 8834 | -0.214 | -0.0674 | No |
| 42 | Il15ra | 9613 | -0.274 | -0.1124 | No |
| 43 | Il3ra | 9620 | -0.274 | -0.0950 | No |
| 44 | Ptpn1 | 9920 | -0.299 | -0.0997 | No |
| 45 | Ifngr2 | 9933 | -0.301 | -0.0811 | No |
| 46 | Il10rb | 10017 | -0.307 | -0.0678 | No |
| 47 | Cbl | 10496 | -0.356 | -0.0832 | No |
| 48 | Cd9 | 10524 | -0.360 | -0.0619 | No |
| 49 | Irf9 | 10615 | -0.370 | -0.0451 | No |
| 50 | Il4ra | 11300 | -0.459 | -0.0705 | No |
| 51 | Ptpn2 | 11851 | -0.575 | -0.0774 | No |
| 52 | Tnfrsf21 | 11877 | -0.580 | -0.0417 | No |
| 53 | Il17ra | 12013 | -0.623 | -0.0120 | No |
| 54 | Tgfb1 | 12207 | -0.714 | 0.0189 | No |