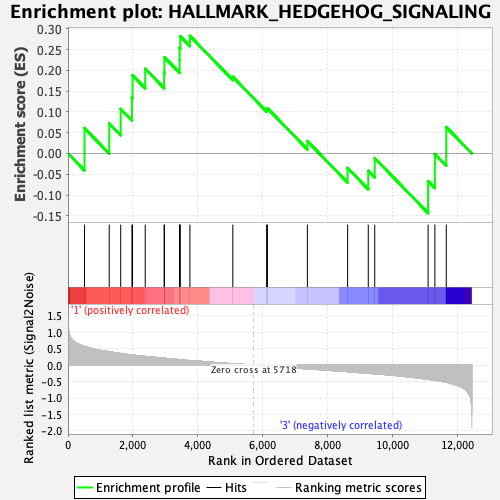
Profile of the Running ES Score & Positions of GeneSet Members on the Rank Ordered List
| Dataset | Mast.Mast_Pheno.cls #Group2_versus_Group4.Mast_Pheno.cls #Group2_versus_Group4_repos |
| Phenotype | Mast_Pheno.cls#Group2_versus_Group4_repos |
| Upregulated in class | 1 |
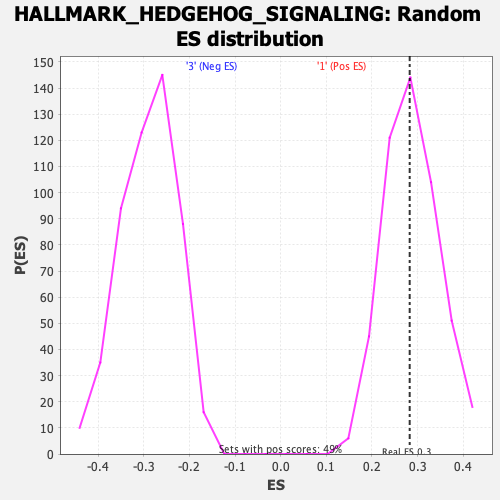
| GeneSet | HALLMARK_HEDGEHOG_SIGNALING |
| Enrichment Score (ES) | 0.28277734 |
| Normalized Enrichment Score (NES) | 0.98575354 |
| Nominal p-value | 0.5153374 |
| FDR q-value | 1.0 |
| FWER p-Value | 0.995 |
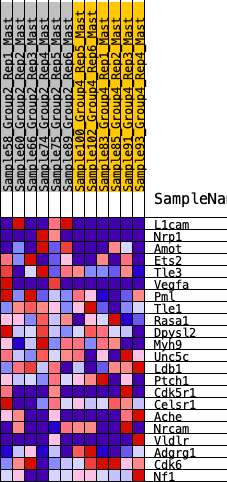
| SYMBOL | RANK IN GENE LIST | RANK METRIC SCORE | RUNNING ES | CORE ENRICHMENT | |
|---|---|---|---|---|---|
| 1 | L1cam | 508 | 0.570 | 0.0608 | Yes |
| 2 | Nrp1 | 1270 | 0.406 | 0.0721 | Yes |
| 3 | Amot | 1624 | 0.355 | 0.1070 | Yes |
| 4 | Ets2 | 1970 | 0.310 | 0.1345 | Yes |
| 5 | Tle3 | 1988 | 0.308 | 0.1881 | Yes |
| 6 | Vegfa | 2379 | 0.264 | 0.2038 | Yes |
| 7 | Pml | 2962 | 0.211 | 0.1946 | Yes |
| 8 | Tle1 | 2971 | 0.210 | 0.2314 | Yes |
| 9 | Rasa1 | 3437 | 0.168 | 0.2240 | Yes |
| 10 | Dpysl2 | 3439 | 0.168 | 0.2539 | Yes |
| 11 | Myh9 | 3460 | 0.166 | 0.2818 | Yes |
| 12 | Unc5c | 3756 | 0.138 | 0.2828 | Yes |
| 13 | Ldb1 | 5078 | 0.044 | 0.1842 | No |
| 14 | Ptch1 | 6119 | -0.028 | 0.1055 | No |
| 15 | Cdk5r1 | 6144 | -0.029 | 0.1087 | No |
| 16 | Celsr1 | 7375 | -0.112 | 0.0296 | No |
| 17 | Ache | 8615 | -0.197 | -0.0351 | No |
| 18 | Nrcam | 9251 | -0.248 | -0.0420 | No |
| 19 | Vldlr | 9450 | -0.262 | -0.0113 | No |
| 20 | Adgrg1 | 11095 | -0.431 | -0.0667 | No |
| 21 | Cdk6 | 11303 | -0.459 | -0.0014 | No |
| 22 | Nf1 | 11654 | -0.521 | 0.0634 | No |