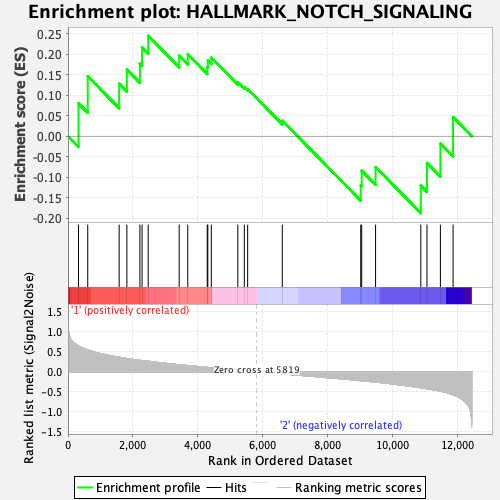
Profile of the Running ES Score & Positions of GeneSet Members on the Rank Ordered List
| Dataset | Mast.Mast_Pheno.cls #Group2_versus_Group3.Mast_Pheno.cls #Group2_versus_Group3_repos |
| Phenotype | Mast_Pheno.cls#Group2_versus_Group3_repos |
| Upregulated in class | 1 |
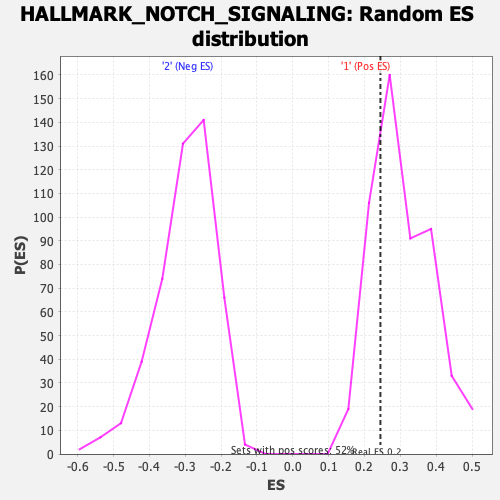
| GeneSet | HALLMARK_NOTCH_SIGNALING |
| Enrichment Score (ES) | 0.24441177 |
| Normalized Enrichment Score (NES) | 0.7998247 |
| Nominal p-value | 0.73996174 |
| FDR q-value | 1.0 |
| FWER p-Value | 1.0 |
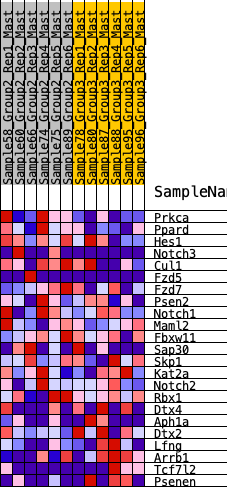
| SYMBOL | RANK IN GENE LIST | RANK METRIC SCORE | RUNNING ES | CORE ENRICHMENT | |
|---|---|---|---|---|---|
| 1 | Prkca | 323 | 0.643 | 0.0800 | Yes |
| 2 | Ppard | 608 | 0.539 | 0.1460 | Yes |
| 3 | Hes1 | 1576 | 0.360 | 0.1275 | Yes |
| 4 | Notch3 | 1814 | 0.326 | 0.1622 | Yes |
| 5 | Cul1 | 2215 | 0.282 | 0.1765 | Yes |
| 6 | Fzd5 | 2282 | 0.276 | 0.2166 | Yes |
| 7 | Fzd7 | 2471 | 0.260 | 0.2444 | Yes |
| 8 | Psen2 | 3425 | 0.172 | 0.1960 | No |
| 9 | Notch1 | 3690 | 0.150 | 0.1995 | No |
| 10 | Maml2 | 4289 | 0.105 | 0.1687 | No |
| 11 | Fbxw11 | 4308 | 0.104 | 0.1844 | No |
| 12 | Sap30 | 4415 | 0.094 | 0.1913 | No |
| 13 | Skp1 | 5232 | 0.038 | 0.1318 | No |
| 14 | Kat2a | 5432 | 0.025 | 0.1199 | No |
| 15 | Notch2 | 5535 | 0.018 | 0.1147 | No |
| 16 | Rbx1 | 6602 | -0.054 | 0.0377 | No |
| 17 | Dtx4 | 9019 | -0.226 | -0.1195 | No |
| 18 | Aph1a | 9049 | -0.229 | -0.0842 | No |
| 19 | Dtx2 | 9476 | -0.262 | -0.0753 | No |
| 20 | Lfng | 10870 | -0.405 | -0.1207 | No |
| 21 | Arrb1 | 11060 | -0.427 | -0.0654 | No |
| 22 | Tcf7l2 | 11473 | -0.488 | -0.0180 | No |
| 23 | Psenen | 11864 | -0.581 | 0.0465 | No |