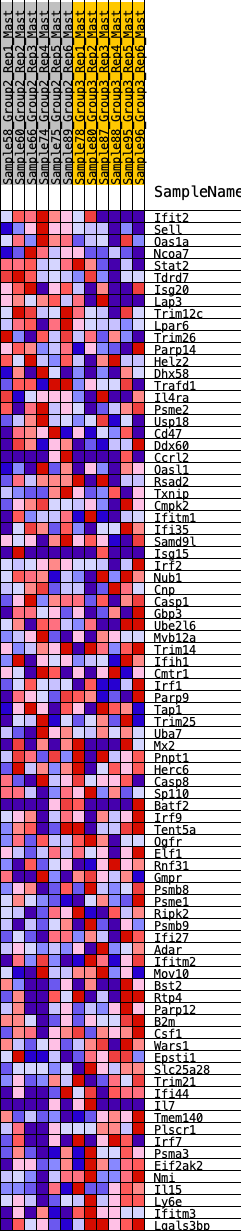
Profile of the Running ES Score & Positions of GeneSet Members on the Rank Ordered List
| Dataset | Mast.Mast_Pheno.cls #Group2_versus_Group3.Mast_Pheno.cls #Group2_versus_Group3_repos |
| Phenotype | Mast_Pheno.cls#Group2_versus_Group3_repos |
| Upregulated in class | 2 |
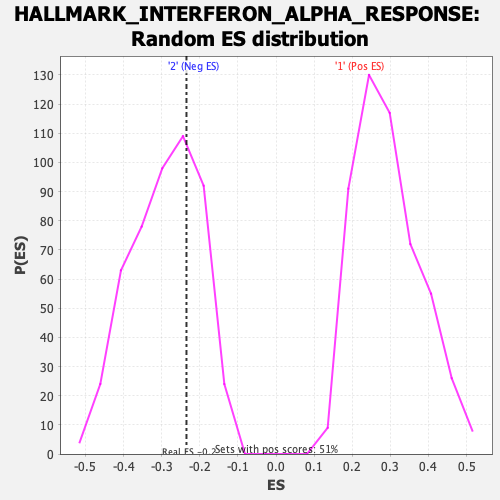
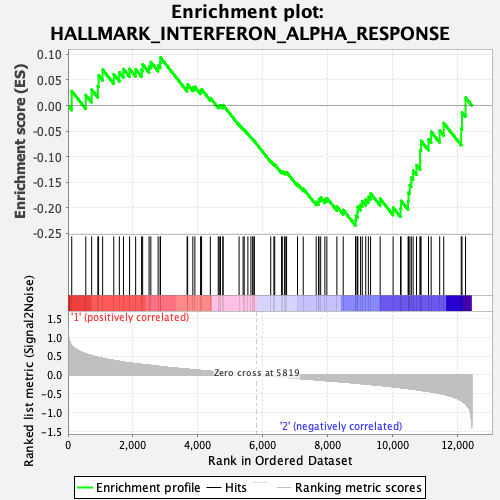
| GeneSet | HALLMARK_INTERFERON_ALPHA_RESPONSE |
| Enrichment Score (ES) | -0.23488477 |
| Normalized Enrichment Score (NES) | -0.8102461 |
| Nominal p-value | 0.6808943 |
| FDR q-value | 0.9208228 |
| FWER p-Value | 1.0 |
| SYMBOL | RANK IN GENE LIST | RANK METRIC SCORE | RUNNING ES | CORE ENRICHMENT | |
|---|---|---|---|---|---|
| 1 | Ifit2 | 115 | 0.776 | 0.0284 | No |
| 2 | Sell | 548 | 0.559 | 0.0207 | No |
| 3 | Oas1a | 729 | 0.510 | 0.0309 | No |
| 4 | Ncoa7 | 920 | 0.466 | 0.0382 | No |
| 5 | Stat2 | 942 | 0.462 | 0.0590 | No |
| 6 | Tdrd7 | 1067 | 0.438 | 0.0703 | No |
| 7 | Isg20 | 1410 | 0.386 | 0.0614 | No |
| 8 | Lap3 | 1582 | 0.360 | 0.0650 | No |
| 9 | Trim12c | 1709 | 0.341 | 0.0714 | No |
| 10 | Lpar6 | 1897 | 0.317 | 0.0717 | No |
| 11 | Trim26 | 2084 | 0.295 | 0.0711 | No |
| 12 | Parp14 | 2267 | 0.277 | 0.0698 | No |
| 13 | Helz2 | 2300 | 0.275 | 0.0806 | No |
| 14 | Dhx58 | 2498 | 0.258 | 0.0772 | No |
| 15 | Trafd1 | 2552 | 0.251 | 0.0851 | No |
| 16 | Il4ra | 2776 | 0.229 | 0.0782 | No |
| 17 | Psme2 | 2839 | 0.222 | 0.0840 | No |
| 18 | Usp18 | 2848 | 0.222 | 0.0942 | No |
| 19 | Cd47 | 3670 | 0.152 | 0.0351 | No |
| 20 | Ddx60 | 3686 | 0.151 | 0.0412 | No |
| 21 | Ccrl2 | 3846 | 0.140 | 0.0352 | No |
| 22 | Oasl1 | 3909 | 0.134 | 0.0367 | No |
| 23 | Rsad2 | 4084 | 0.120 | 0.0284 | No |
| 24 | Txnip | 4115 | 0.117 | 0.0317 | No |
| 25 | Cmpk2 | 4385 | 0.097 | 0.0146 | No |
| 26 | Ifitm1 | 4629 | 0.077 | -0.0013 | No |
| 27 | Ifi35 | 4661 | 0.075 | -0.0001 | No |
| 28 | Samd9l | 4697 | 0.073 | 0.0006 | No |
| 29 | Isg15 | 4772 | 0.069 | -0.0020 | No |
| 30 | Irf2 | 4777 | 0.069 | 0.0010 | No |
| 31 | Nub1 | 5271 | 0.035 | -0.0372 | No |
| 32 | Cnp | 5394 | 0.028 | -0.0457 | No |
| 33 | Casp1 | 5429 | 0.025 | -0.0473 | No |
| 34 | Gbp3 | 5542 | 0.018 | -0.0555 | No |
| 35 | Ube2l6 | 5636 | 0.012 | -0.0624 | No |
| 36 | Mvb12a | 5691 | 0.008 | -0.0664 | No |
| 37 | Trim14 | 5701 | 0.008 | -0.0667 | No |
| 38 | Ifih1 | 5743 | 0.005 | -0.0698 | No |
| 39 | Cmtr1 | 6246 | -0.029 | -0.1090 | No |
| 40 | Irf1 | 6343 | -0.035 | -0.1151 | No |
| 41 | Parp9 | 6368 | -0.037 | -0.1152 | No |
| 42 | Tap1 | 6581 | -0.053 | -0.1298 | No |
| 43 | Trim25 | 6601 | -0.054 | -0.1287 | No |
| 44 | Uba7 | 6667 | -0.058 | -0.1311 | No |
| 45 | Mx2 | 6710 | -0.062 | -0.1315 | No |
| 46 | Pnpt1 | 6734 | -0.063 | -0.1303 | No |
| 47 | Herc6 | 7071 | -0.089 | -0.1532 | No |
| 48 | Casp8 | 7247 | -0.099 | -0.1625 | No |
| 49 | Sp110 | 7646 | -0.126 | -0.1886 | No |
| 50 | Batf2 | 7719 | -0.131 | -0.1881 | No |
| 51 | Irf9 | 7733 | -0.132 | -0.1827 | No |
| 52 | Tent5a | 7785 | -0.136 | -0.1802 | No |
| 53 | Ogfr | 7914 | -0.147 | -0.1834 | No |
| 54 | Elf1 | 7975 | -0.151 | -0.1809 | No |
| 55 | Rnf31 | 8284 | -0.171 | -0.1975 | No |
| 56 | Gmpr | 8479 | -0.184 | -0.2042 | No |
| 57 | Psmb8 | 8859 | -0.214 | -0.2245 | Yes |
| 58 | Psme1 | 8872 | -0.214 | -0.2151 | Yes |
| 59 | Ripk2 | 8923 | -0.218 | -0.2085 | Yes |
| 60 | Psmb9 | 8926 | -0.219 | -0.1980 | Yes |
| 61 | Ifi27 | 9014 | -0.226 | -0.1940 | Yes |
| 62 | Adar | 9066 | -0.230 | -0.1870 | Yes |
| 63 | Ifitm2 | 9173 | -0.239 | -0.1839 | Yes |
| 64 | Mov10 | 9254 | -0.244 | -0.1785 | Yes |
| 65 | Bst2 | 9322 | -0.251 | -0.1718 | Yes |
| 66 | Rtp4 | 9617 | -0.273 | -0.1822 | Yes |
| 67 | Parp12 | 10016 | -0.310 | -0.1993 | Yes |
| 68 | B2m | 10245 | -0.334 | -0.2016 | Yes |
| 69 | Csf1 | 10261 | -0.336 | -0.1864 | Yes |
| 70 | Wars1 | 10478 | -0.358 | -0.1865 | Yes |
| 71 | Epsti1 | 10490 | -0.359 | -0.1699 | Yes |
| 72 | Slc25a28 | 10531 | -0.364 | -0.1554 | Yes |
| 73 | Trim21 | 10577 | -0.370 | -0.1410 | Yes |
| 74 | Ifi44 | 10633 | -0.376 | -0.1272 | Yes |
| 75 | Il7 | 10737 | -0.387 | -0.1167 | Yes |
| 76 | Tmem140 | 10849 | -0.401 | -0.1061 | Yes |
| 77 | Plscr1 | 10850 | -0.401 | -0.0866 | Yes |
| 78 | Irf7 | 10878 | -0.406 | -0.0690 | Yes |
| 79 | Psma3 | 11106 | -0.433 | -0.0663 | Yes |
| 80 | Eif2ak2 | 11189 | -0.445 | -0.0513 | Yes |
| 81 | Nmi | 11451 | -0.485 | -0.0488 | Yes |
| 82 | Il15 | 11576 | -0.506 | -0.0342 | Yes |
| 83 | Ly6e | 12115 | -0.676 | -0.0448 | Yes |
| 84 | Ifitm3 | 12139 | -0.691 | -0.0130 | Yes |
| 85 | Lgals3bp | 12248 | -0.768 | 0.0156 | Yes |