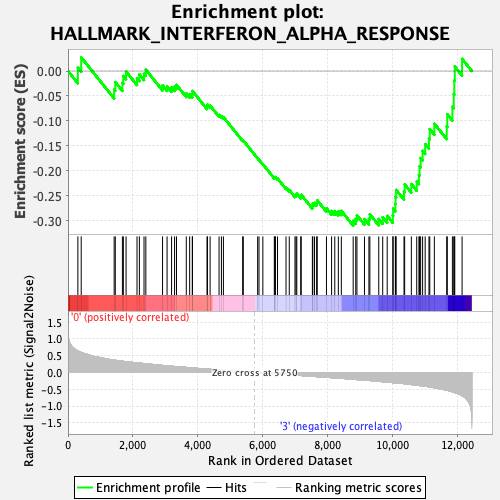
Profile of the Running ES Score & Positions of GeneSet Members on the Rank Ordered List
| Dataset | Mast.Mast_Pheno.cls #Group1_versus_Group4.Mast_Pheno.cls #Group1_versus_Group4_repos |
| Phenotype | Mast_Pheno.cls#Group1_versus_Group4_repos |
| Upregulated in class | 3 |
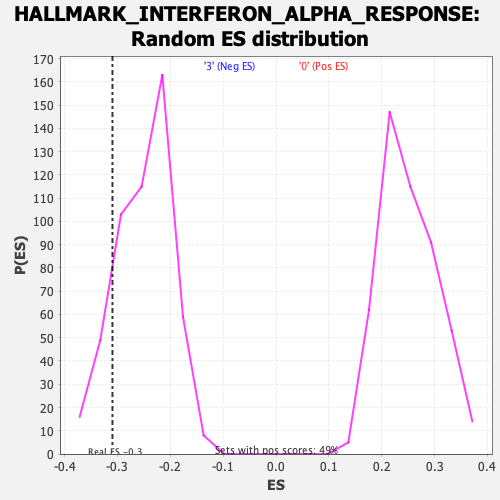
| GeneSet | HALLMARK_INTERFERON_ALPHA_RESPONSE |
| Enrichment Score (ES) | -0.309394 |
| Normalized Enrichment Score (NES) | -1.2379808 |
| Nominal p-value | 0.14814815 |
| FDR q-value | 0.38376364 |
| FWER p-Value | 0.904 |
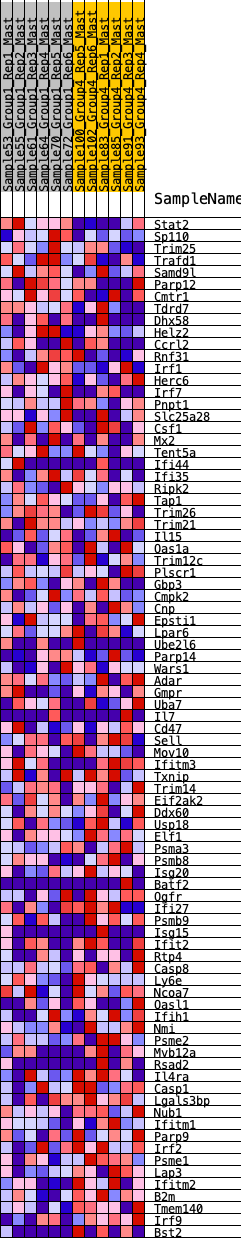
| SYMBOL | RANK IN GENE LIST | RANK METRIC SCORE | RUNNING ES | CORE ENRICHMENT | |
|---|---|---|---|---|---|
| 1 | Stat2 | 304 | 0.643 | 0.0065 | No |
| 2 | Sp110 | 407 | 0.597 | 0.0272 | No |
| 3 | Trim25 | 1422 | 0.368 | -0.0370 | No |
| 4 | Trafd1 | 1457 | 0.364 | -0.0222 | No |
| 5 | Samd9l | 1676 | 0.334 | -0.0236 | No |
| 6 | Parp12 | 1705 | 0.331 | -0.0099 | No |
| 7 | Cmtr1 | 1789 | 0.323 | -0.0010 | No |
| 8 | Tdrd7 | 2126 | 0.285 | -0.0143 | No |
| 9 | Dhx58 | 2199 | 0.277 | -0.0067 | No |
| 10 | Helz2 | 2342 | 0.265 | -0.0054 | No |
| 11 | Ccrl2 | 2398 | 0.258 | 0.0026 | No |
| 12 | Rnf31 | 2913 | 0.209 | -0.0289 | No |
| 13 | Irf1 | 3052 | 0.196 | -0.0305 | No |
| 14 | Herc6 | 3191 | 0.185 | -0.0328 | No |
| 15 | Irf7 | 3283 | 0.179 | -0.0315 | No |
| 16 | Pnpt1 | 3342 | 0.175 | -0.0277 | No |
| 17 | Slc25a28 | 3644 | 0.150 | -0.0448 | No |
| 18 | Csf1 | 3748 | 0.141 | -0.0463 | No |
| 19 | Mx2 | 3830 | 0.135 | -0.0463 | No |
| 20 | Tent5a | 3834 | 0.134 | -0.0401 | No |
| 21 | Ifi44 | 4283 | 0.103 | -0.0713 | No |
| 22 | Ifi35 | 4297 | 0.102 | -0.0674 | No |
| 23 | Ripk2 | 4378 | 0.095 | -0.0693 | No |
| 24 | Tap1 | 4654 | 0.075 | -0.0879 | No |
| 25 | Trim26 | 4727 | 0.069 | -0.0904 | No |
| 26 | Trim21 | 4788 | 0.065 | -0.0922 | No |
| 27 | Il15 | 5381 | 0.025 | -0.1389 | No |
| 28 | Oas1a | 5400 | 0.024 | -0.1392 | No |
| 29 | Trim12c | 5843 | -0.004 | -0.1747 | No |
| 30 | Plscr1 | 5884 | -0.007 | -0.1776 | No |
| 31 | Gbp3 | 6003 | -0.014 | -0.1865 | No |
| 32 | Cmpk2 | 6356 | -0.037 | -0.2132 | No |
| 33 | Cnp | 6371 | -0.038 | -0.2125 | No |
| 34 | Epsti1 | 6391 | -0.039 | -0.2121 | No |
| 35 | Lpar6 | 6455 | -0.044 | -0.2151 | No |
| 36 | Ube2l6 | 6717 | -0.059 | -0.2334 | No |
| 37 | Parp14 | 6817 | -0.065 | -0.2382 | No |
| 38 | Wars1 | 6993 | -0.077 | -0.2487 | No |
| 39 | Adar | 7025 | -0.078 | -0.2474 | No |
| 40 | Gmpr | 7049 | -0.080 | -0.2454 | No |
| 41 | Uba7 | 7170 | -0.088 | -0.2508 | No |
| 42 | Il7 | 7185 | -0.089 | -0.2477 | No |
| 43 | Cd47 | 7529 | -0.113 | -0.2700 | No |
| 44 | Sell | 7542 | -0.114 | -0.2654 | No |
| 45 | Mov10 | 7595 | -0.117 | -0.2640 | No |
| 46 | Ifitm3 | 7660 | -0.121 | -0.2633 | No |
| 47 | Txnip | 7678 | -0.123 | -0.2587 | No |
| 48 | Trim14 | 7963 | -0.142 | -0.2748 | No |
| 49 | Eif2ak2 | 8121 | -0.153 | -0.2801 | No |
| 50 | Ddx60 | 8219 | -0.160 | -0.2802 | No |
| 51 | Usp18 | 8329 | -0.167 | -0.2810 | No |
| 52 | Elf1 | 8421 | -0.174 | -0.2799 | No |
| 53 | Psma3 | 8786 | -0.201 | -0.2997 | Yes |
| 54 | Psmb8 | 8865 | -0.208 | -0.2959 | Yes |
| 55 | Isg20 | 8902 | -0.210 | -0.2887 | Yes |
| 56 | Batf2 | 9134 | -0.226 | -0.2964 | Yes |
| 57 | Ogfr | 9271 | -0.236 | -0.2960 | Yes |
| 58 | Ifi27 | 9300 | -0.239 | -0.2867 | Yes |
| 59 | Psmb9 | 9574 | -0.263 | -0.2961 | Yes |
| 60 | Isg15 | 9696 | -0.273 | -0.2926 | Yes |
| 61 | Ifit2 | 9834 | -0.285 | -0.2899 | Yes |
| 62 | Rtp4 | 10007 | -0.301 | -0.2892 | Yes |
| 63 | Casp8 | 10017 | -0.301 | -0.2754 | Yes |
| 64 | Ly6e | 10085 | -0.307 | -0.2659 | Yes |
| 65 | Ncoa7 | 10091 | -0.307 | -0.2515 | Yes |
| 66 | Oasl1 | 10110 | -0.308 | -0.2380 | Yes |
| 67 | Ifih1 | 10352 | -0.331 | -0.2415 | Yes |
| 68 | Nmi | 10372 | -0.334 | -0.2268 | Yes |
| 69 | Psme2 | 10578 | -0.357 | -0.2262 | Yes |
| 70 | Mvb12a | 10744 | -0.378 | -0.2212 | Yes |
| 71 | Rsad2 | 10812 | -0.386 | -0.2080 | Yes |
| 72 | Il4ra | 10831 | -0.388 | -0.1907 | Yes |
| 73 | Casp1 | 10864 | -0.392 | -0.1743 | Yes |
| 74 | Lgals3bp | 10925 | -0.399 | -0.1598 | Yes |
| 75 | Nub1 | 11004 | -0.411 | -0.1462 | Yes |
| 76 | Ifitm1 | 11121 | -0.425 | -0.1350 | Yes |
| 77 | Parp9 | 11146 | -0.428 | -0.1162 | Yes |
| 78 | Irf2 | 11287 | -0.454 | -0.1056 | Yes |
| 79 | Psme1 | 11668 | -0.526 | -0.1109 | Yes |
| 80 | Lap3 | 11685 | -0.530 | -0.0865 | Yes |
| 81 | Ifitm2 | 11843 | -0.573 | -0.0715 | Yes |
| 82 | B2m | 11885 | -0.587 | -0.0464 | Yes |
| 83 | Tmem140 | 11902 | -0.593 | -0.0190 | Yes |
| 84 | Irf9 | 11916 | -0.599 | 0.0090 | Yes |
| 85 | Bst2 | 12141 | -0.691 | 0.0243 | Yes |