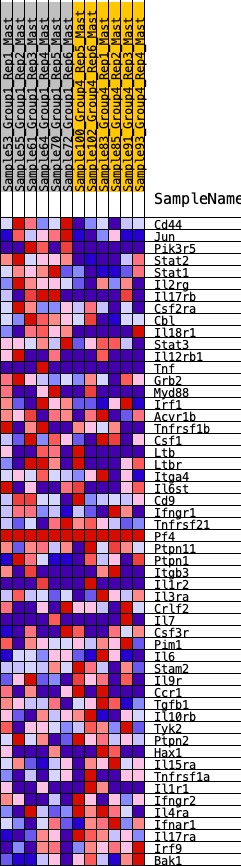
Profile of the Running ES Score & Positions of GeneSet Members on the Rank Ordered List
| Dataset | Mast.Mast_Pheno.cls #Group1_versus_Group4.Mast_Pheno.cls #Group1_versus_Group4_repos |
| Phenotype | Mast_Pheno.cls#Group1_versus_Group4_repos |
| Upregulated in class | 0 |
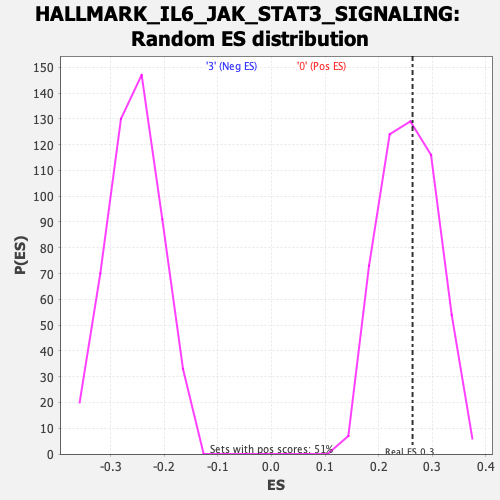
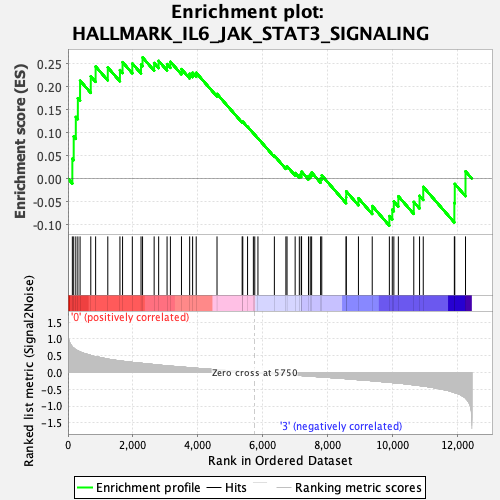
| GeneSet | HALLMARK_IL6_JAK_STAT3_SIGNALING |
| Enrichment Score (ES) | 0.26322263 |
| Normalized Enrichment Score (NES) | 1.0256494 |
| Nominal p-value | 0.4734774 |
| FDR q-value | 0.72643626 |
| FWER p-Value | 1.0 |
| SYMBOL | RANK IN GENE LIST | RANK METRIC SCORE | RUNNING ES | CORE ENRICHMENT | |
|---|---|---|---|---|---|
| 1 | Cd44 | 134 | 0.761 | 0.0432 | Yes |
| 2 | Jun | 176 | 0.726 | 0.0914 | Yes |
| 3 | Pik3r5 | 241 | 0.672 | 0.1339 | Yes |
| 4 | Stat2 | 304 | 0.643 | 0.1745 | Yes |
| 5 | Stat1 | 372 | 0.614 | 0.2127 | Yes |
| 6 | Il2rg | 702 | 0.507 | 0.2221 | Yes |
| 7 | Il17rb | 851 | 0.469 | 0.2434 | Yes |
| 8 | Csf2ra | 1226 | 0.396 | 0.2414 | Yes |
| 9 | Cbl | 1600 | 0.344 | 0.2356 | Yes |
| 10 | Il18r1 | 1681 | 0.334 | 0.2529 | Yes |
| 11 | Stat3 | 1982 | 0.300 | 0.2500 | Yes |
| 12 | Il12rb1 | 2250 | 0.274 | 0.2478 | Yes |
| 13 | Tnf | 2297 | 0.269 | 0.2632 | Yes |
| 14 | Grb2 | 2654 | 0.234 | 0.2511 | No |
| 15 | Myd88 | 2793 | 0.221 | 0.2557 | No |
| 16 | Irf1 | 3052 | 0.196 | 0.2487 | No |
| 17 | Acvr1b | 3155 | 0.187 | 0.2538 | No |
| 18 | Tnfrsf1b | 3496 | 0.162 | 0.2378 | No |
| 19 | Csf1 | 3748 | 0.141 | 0.2276 | No |
| 20 | Ltb | 3839 | 0.134 | 0.2299 | No |
| 21 | Ltbr | 3950 | 0.125 | 0.2299 | No |
| 22 | Itga4 | 4591 | 0.080 | 0.1839 | No |
| 23 | Il6st | 5366 | 0.026 | 0.1232 | No |
| 24 | Cd9 | 5385 | 0.024 | 0.1235 | No |
| 25 | Ifngr1 | 5532 | 0.015 | 0.1128 | No |
| 26 | Tnfrsf21 | 5711 | 0.002 | 0.0985 | No |
| 27 | Pf4 | 5754 | 0.000 | 0.0951 | No |
| 28 | Ptpn11 | 5852 | -0.005 | 0.0876 | No |
| 29 | Ptpn1 | 6358 | -0.037 | 0.0495 | No |
| 30 | Itgb3 | 6713 | -0.058 | 0.0251 | No |
| 31 | Il1r2 | 6748 | -0.061 | 0.0266 | No |
| 32 | Il3ra | 6998 | -0.077 | 0.0120 | No |
| 33 | Crlf2 | 7127 | -0.085 | 0.0077 | No |
| 34 | Il7 | 7185 | -0.089 | 0.0094 | No |
| 35 | Csf3r | 7196 | -0.090 | 0.0150 | No |
| 36 | Pim1 | 7409 | -0.104 | 0.0053 | No |
| 37 | Il6 | 7463 | -0.108 | 0.0087 | No |
| 38 | Stam2 | 7506 | -0.111 | 0.0132 | No |
| 39 | Il9r | 7783 | -0.130 | 0.0002 | No |
| 40 | Ccr1 | 7818 | -0.132 | 0.0068 | No |
| 41 | Tgfb1 | 8568 | -0.184 | -0.0406 | No |
| 42 | Il10rb | 8572 | -0.184 | -0.0278 | No |
| 43 | Tyk2 | 8948 | -0.214 | -0.0429 | No |
| 44 | Ptpn2 | 9373 | -0.245 | -0.0597 | No |
| 45 | Hax1 | 9901 | -0.292 | -0.0816 | No |
| 46 | Il15ra | 9991 | -0.300 | -0.0675 | No |
| 47 | Tnfrsf1a | 10039 | -0.304 | -0.0497 | No |
| 48 | Il1r1 | 10178 | -0.315 | -0.0386 | No |
| 49 | Ifngr2 | 10653 | -0.367 | -0.0508 | No |
| 50 | Il4ra | 10831 | -0.388 | -0.0375 | No |
| 51 | Ifnar1 | 10945 | -0.402 | -0.0181 | No |
| 52 | Il17ra | 11903 | -0.594 | -0.0532 | No |
| 53 | Irf9 | 11916 | -0.599 | -0.0117 | No |
| 54 | Bak1 | 12247 | -0.760 | 0.0157 | No |