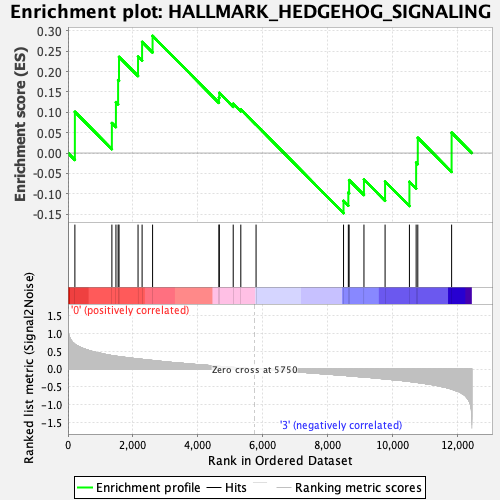
Profile of the Running ES Score & Positions of GeneSet Members on the Rank Ordered List
| Dataset | Mast.Mast_Pheno.cls #Group1_versus_Group4.Mast_Pheno.cls #Group1_versus_Group4_repos |
| Phenotype | Mast_Pheno.cls#Group1_versus_Group4_repos |
| Upregulated in class | 0 |
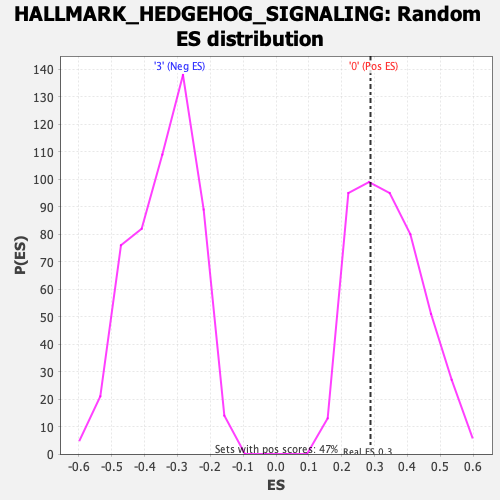
| GeneSet | HALLMARK_HEDGEHOG_SIGNALING |
| Enrichment Score (ES) | 0.2875455 |
| Normalized Enrichment Score (NES) | 0.84526587 |
| Nominal p-value | 0.6630901 |
| FDR q-value | 0.8674935 |
| FWER p-Value | 1.0 |
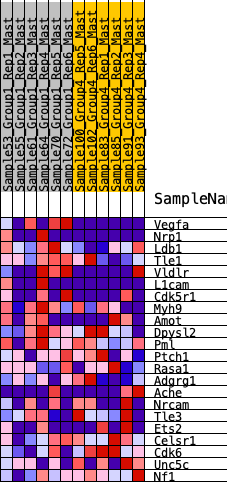
| SYMBOL | RANK IN GENE LIST | RANK METRIC SCORE | RUNNING ES | CORE ENRICHMENT | |
|---|---|---|---|---|---|
| 1 | Vegfa | 212 | 0.695 | 0.1012 | Yes |
| 2 | Nrp1 | 1352 | 0.377 | 0.0736 | Yes |
| 3 | Ldb1 | 1477 | 0.360 | 0.1249 | Yes |
| 4 | Tle1 | 1544 | 0.351 | 0.1792 | Yes |
| 5 | Vldlr | 1572 | 0.347 | 0.2360 | Yes |
| 6 | L1cam | 2158 | 0.281 | 0.2367 | Yes |
| 7 | Cdk5r1 | 2283 | 0.271 | 0.2728 | Yes |
| 8 | Myh9 | 2606 | 0.239 | 0.2875 | Yes |
| 9 | Amot | 4650 | 0.075 | 0.1359 | No |
| 10 | Dpysl2 | 4661 | 0.074 | 0.1477 | No |
| 11 | Pml | 5090 | 0.046 | 0.1210 | No |
| 12 | Ptch1 | 5324 | 0.028 | 0.1069 | No |
| 13 | Rasa1 | 5794 | -0.001 | 0.0694 | No |
| 14 | Adgrg1 | 8489 | -0.178 | -0.1174 | No |
| 15 | Ache | 8637 | -0.189 | -0.0971 | No |
| 16 | Nrcam | 8661 | -0.191 | -0.0664 | No |
| 17 | Tle3 | 9118 | -0.225 | -0.0649 | No |
| 18 | Ets2 | 9769 | -0.279 | -0.0698 | No |
| 19 | Celsr1 | 10519 | -0.350 | -0.0706 | No |
| 20 | Cdk6 | 10726 | -0.376 | -0.0233 | No |
| 21 | Unc5c | 10777 | -0.381 | 0.0374 | No |
| 22 | Nf1 | 11819 | -0.567 | 0.0501 | No |