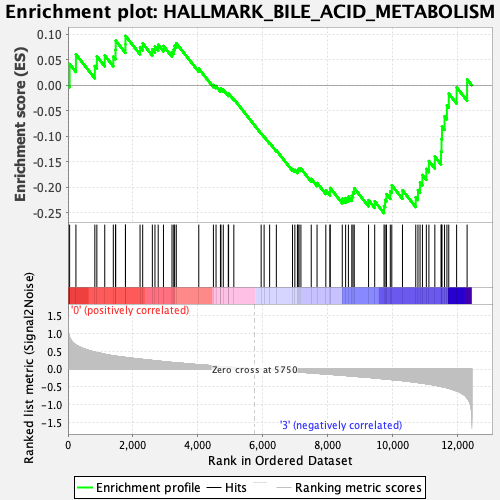
Profile of the Running ES Score & Positions of GeneSet Members on the Rank Ordered List
| Dataset | Mast.Mast_Pheno.cls #Group1_versus_Group4.Mast_Pheno.cls #Group1_versus_Group4_repos |
| Phenotype | Mast_Pheno.cls#Group1_versus_Group4_repos |
| Upregulated in class | 3 |
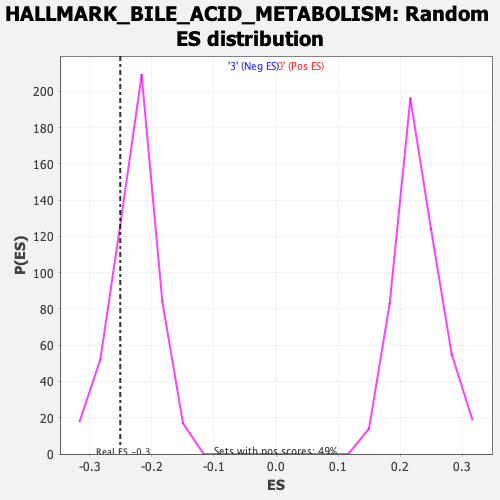
| GeneSet | HALLMARK_BILE_ACID_METABOLISM |
| Enrichment Score (ES) | -0.2505537 |
| Normalized Enrichment Score (NES) | -1.0979661 |
| Nominal p-value | 0.25540274 |
| FDR q-value | 0.5695558 |
| FWER p-Value | 0.994 |
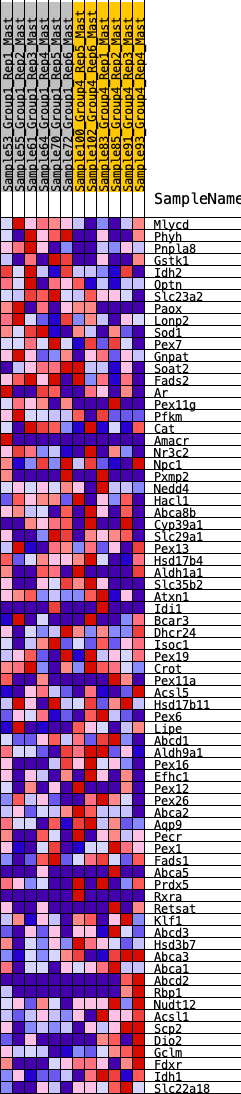
| SYMBOL | RANK IN GENE LIST | RANK METRIC SCORE | RUNNING ES | CORE ENRICHMENT | |
|---|---|---|---|---|---|
| 1 | Mlycd | 50 | 0.890 | 0.0417 | No |
| 2 | Phyh | 244 | 0.671 | 0.0607 | No |
| 3 | Pnpla8 | 827 | 0.473 | 0.0379 | No |
| 4 | Gstk1 | 889 | 0.461 | 0.0567 | No |
| 5 | Idh2 | 1132 | 0.414 | 0.0585 | No |
| 6 | Optn | 1396 | 0.370 | 0.0562 | No |
| 7 | Slc23a2 | 1463 | 0.363 | 0.0696 | No |
| 8 | Paox | 1470 | 0.361 | 0.0877 | No |
| 9 | Lonp2 | 1769 | 0.325 | 0.0803 | No |
| 10 | Sod1 | 1771 | 0.325 | 0.0969 | No |
| 11 | Pex7 | 2220 | 0.276 | 0.0748 | No |
| 12 | Gnpat | 2301 | 0.269 | 0.0822 | No |
| 13 | Soat2 | 2599 | 0.240 | 0.0706 | No |
| 14 | Fads2 | 2679 | 0.233 | 0.0761 | No |
| 15 | Ar | 2779 | 0.222 | 0.0796 | No |
| 16 | Pex11g | 2941 | 0.206 | 0.0771 | No |
| 17 | Pfkm | 3204 | 0.184 | 0.0654 | No |
| 18 | Cat | 3259 | 0.180 | 0.0703 | No |
| 19 | Amacr | 3285 | 0.178 | 0.0775 | No |
| 20 | Nr3c2 | 3336 | 0.175 | 0.0825 | No |
| 21 | Npc1 | 4029 | 0.120 | 0.0327 | No |
| 22 | Pxmp2 | 4480 | 0.087 | 0.0008 | No |
| 23 | Nedd4 | 4561 | 0.082 | -0.0015 | No |
| 24 | Hacl1 | 4696 | 0.071 | -0.0087 | No |
| 25 | Abca8b | 4712 | 0.069 | -0.0063 | No |
| 26 | Cyp39a1 | 4784 | 0.065 | -0.0087 | No |
| 27 | Slc29a1 | 4938 | 0.055 | -0.0183 | No |
| 28 | Pex13 | 4948 | 0.054 | -0.0162 | No |
| 29 | Hsd17b4 | 5109 | 0.044 | -0.0269 | No |
| 30 | Aldh1a1 | 5951 | -0.012 | -0.0943 | No |
| 31 | Slc35b2 | 6042 | -0.016 | -0.1007 | No |
| 32 | Atxn1 | 6212 | -0.027 | -0.1130 | No |
| 33 | Idi1 | 6419 | -0.041 | -0.1275 | No |
| 34 | Bcar3 | 6917 | -0.072 | -0.1640 | No |
| 35 | Dhcr24 | 6989 | -0.077 | -0.1658 | No |
| 36 | Isoc1 | 7068 | -0.081 | -0.1679 | No |
| 37 | Pex19 | 7088 | -0.082 | -0.1652 | No |
| 38 | Crot | 7119 | -0.084 | -0.1633 | No |
| 39 | Pex11a | 7176 | -0.088 | -0.1633 | No |
| 40 | Acsl5 | 7494 | -0.110 | -0.1833 | No |
| 41 | Hsd17b11 | 7673 | -0.122 | -0.1914 | No |
| 42 | Pex6 | 7943 | -0.141 | -0.2059 | No |
| 43 | Lipe | 8071 | -0.149 | -0.2085 | No |
| 44 | Abcd1 | 8077 | -0.150 | -0.2012 | No |
| 45 | Aldh9a1 | 8450 | -0.176 | -0.2222 | No |
| 46 | Pex16 | 8553 | -0.182 | -0.2211 | No |
| 47 | Efhc1 | 8639 | -0.189 | -0.2183 | No |
| 48 | Pex12 | 8744 | -0.197 | -0.2165 | No |
| 49 | Pex26 | 8781 | -0.200 | -0.2091 | No |
| 50 | Abca2 | 8819 | -0.204 | -0.2016 | No |
| 51 | Aqp9 | 9260 | -0.235 | -0.2251 | No |
| 52 | Pecr | 9449 | -0.252 | -0.2274 | No |
| 53 | Pex1 | 9737 | -0.277 | -0.2363 | Yes |
| 54 | Fads1 | 9770 | -0.279 | -0.2246 | Yes |
| 55 | Abca5 | 9812 | -0.283 | -0.2133 | Yes |
| 56 | Prdx5 | 9930 | -0.294 | -0.2076 | Yes |
| 57 | Rxra | 9976 | -0.298 | -0.1959 | Yes |
| 58 | Retsat | 10305 | -0.326 | -0.2057 | Yes |
| 59 | Klf1 | 10714 | -0.374 | -0.2194 | Yes |
| 60 | Abcd3 | 10782 | -0.382 | -0.2052 | Yes |
| 61 | Hsd3b7 | 10846 | -0.390 | -0.1903 | Yes |
| 62 | Abca3 | 10920 | -0.398 | -0.1757 | Yes |
| 63 | Abca1 | 11040 | -0.416 | -0.1639 | Yes |
| 64 | Abcd2 | 11119 | -0.425 | -0.1484 | Yes |
| 65 | Rbp1 | 11302 | -0.456 | -0.1396 | Yes |
| 66 | Nudt12 | 11493 | -0.491 | -0.1297 | Yes |
| 67 | Acsl1 | 11508 | -0.494 | -0.1055 | Yes |
| 68 | Scp2 | 11522 | -0.498 | -0.0809 | Yes |
| 69 | Dio2 | 11601 | -0.513 | -0.0609 | Yes |
| 70 | Gclm | 11674 | -0.528 | -0.0395 | Yes |
| 71 | Fdxr | 11731 | -0.540 | -0.0163 | Yes |
| 72 | Idh1 | 11973 | -0.617 | -0.0040 | Yes |
| 73 | Slc22a18 | 12296 | -0.813 | 0.0117 | Yes |