Profile of the Running ES Score & Positions of GeneSet Members on the Rank Ordered List
| Dataset | Mast.Mast_Pheno.cls #Group1_versus_Group4.Mast_Pheno.cls #Group1_versus_Group4_repos |
| Phenotype | Mast_Pheno.cls#Group1_versus_Group4_repos |
| Upregulated in class | 0 |
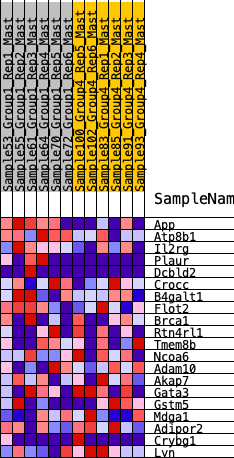
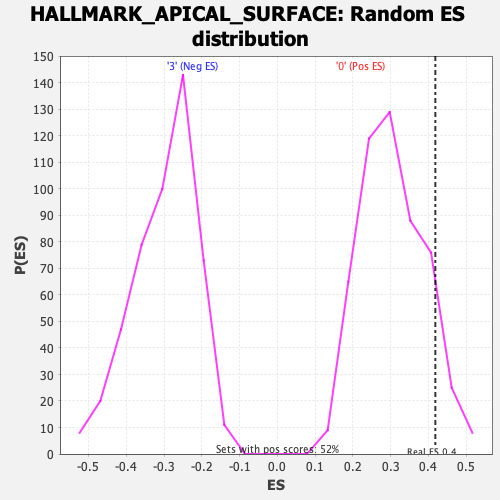
| GeneSet | HALLMARK_APICAL_SURFACE |
| Enrichment Score (ES) | 0.4182295 |
| Normalized Enrichment Score (NES) | 1.3679295 |
| Nominal p-value | 0.08863199 |
| FDR q-value | 0.557381 |
| FWER p-Value | 0.628 |
| SYMBOL | RANK IN GENE LIST | RANK METRIC SCORE | RUNNING ES | CORE ENRICHMENT | |
|---|---|---|---|---|---|
| 1 | App | 72 | 0.844 | 0.1587 | Yes |
| 2 | Atp8b1 | 376 | 0.611 | 0.2534 | Yes |
| 3 | Il2rg | 702 | 0.507 | 0.3260 | Yes |
| 4 | Plaur | 751 | 0.493 | 0.4182 | Yes |
| 5 | Dcbld2 | 2659 | 0.234 | 0.3104 | No |
| 6 | Crocc | 3282 | 0.179 | 0.2951 | No |
| 7 | B4galt1 | 3413 | 0.168 | 0.3173 | No |
| 8 | Flot2 | 3886 | 0.131 | 0.3048 | No |
| 9 | Brca1 | 6192 | -0.026 | 0.1243 | No |
| 10 | Rtn4rl1 | 6845 | -0.067 | 0.0850 | No |
| 11 | Tmem8b | 6916 | -0.072 | 0.0933 | No |
| 12 | Ncoa6 | 6962 | -0.075 | 0.1042 | No |
| 13 | Adam10 | 7130 | -0.085 | 0.1073 | No |
| 14 | Akap7 | 7374 | -0.102 | 0.1077 | No |
| 15 | Gata3 | 8347 | -0.168 | 0.0622 | No |
| 16 | Gstm5 | 9041 | -0.219 | 0.0491 | No |
| 17 | Mdga1 | 9095 | -0.223 | 0.0882 | No |
| 18 | Adipor2 | 9816 | -0.284 | 0.0856 | No |
| 19 | Crybg1 | 10065 | -0.306 | 0.1253 | No |
| 20 | Lyn | 10418 | -0.338 | 0.1629 | No |