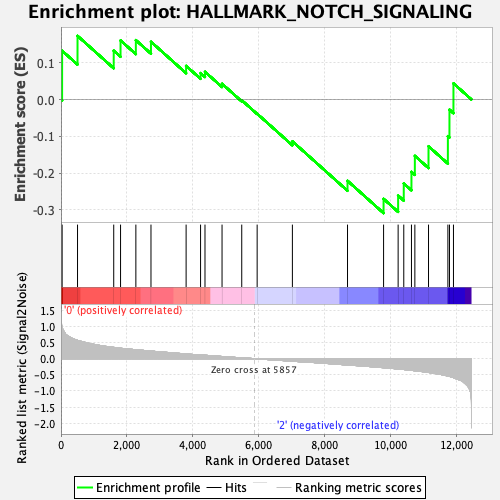
Profile of the Running ES Score & Positions of GeneSet Members on the Rank Ordered List
| Dataset | Mast.Mast_Pheno.cls #Group1_versus_Group3.Mast_Pheno.cls #Group1_versus_Group3_repos |
| Phenotype | Mast_Pheno.cls#Group1_versus_Group3_repos |
| Upregulated in class | 2 |
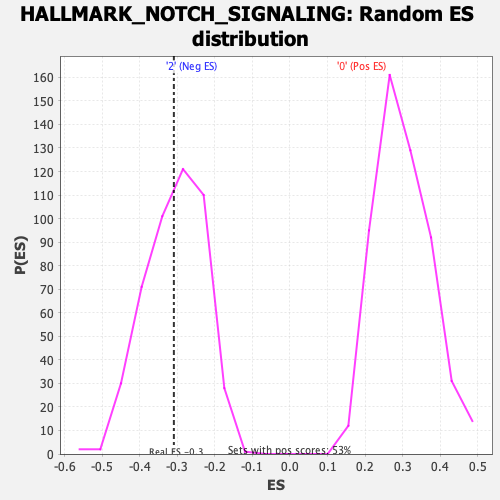
| GeneSet | HALLMARK_NOTCH_SIGNALING |
| Enrichment Score (ES) | -0.309039 |
| Normalized Enrichment Score (NES) | -1.0132834 |
| Nominal p-value | 0.4635193 |
| FDR q-value | 0.78051186 |
| FWER p-Value | 1.0 |
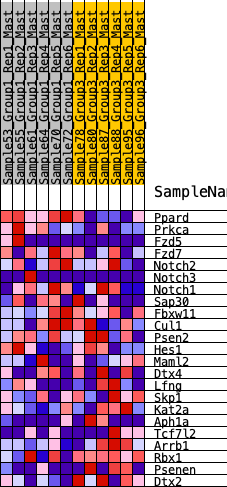
| SYMBOL | RANK IN GENE LIST | RANK METRIC SCORE | RUNNING ES | CORE ENRICHMENT | |
|---|---|---|---|---|---|
| 1 | Ppard | 34 | 0.976 | 0.1325 | No |
| 2 | Prkca | 501 | 0.563 | 0.1731 | No |
| 3 | Fzd5 | 1598 | 0.346 | 0.1328 | No |
| 4 | Fzd7 | 1805 | 0.321 | 0.1607 | No |
| 5 | Notch2 | 2269 | 0.275 | 0.1615 | No |
| 6 | Notch3 | 2727 | 0.234 | 0.1571 | No |
| 7 | Notch1 | 3792 | 0.144 | 0.0914 | No |
| 8 | Sap30 | 4230 | 0.113 | 0.0719 | No |
| 9 | Fbxw11 | 4364 | 0.103 | 0.0755 | No |
| 10 | Cul1 | 4881 | 0.065 | 0.0429 | No |
| 11 | Psen2 | 5478 | 0.023 | -0.0019 | No |
| 12 | Hes1 | 5945 | -0.006 | -0.0386 | No |
| 13 | Maml2 | 7013 | -0.078 | -0.1137 | No |
| 14 | Dtx4 | 8684 | -0.195 | -0.2211 | No |
| 15 | Lfng | 9777 | -0.280 | -0.2702 | Yes |
| 16 | Skp1 | 10218 | -0.321 | -0.2612 | Yes |
| 17 | Kat2a | 10389 | -0.336 | -0.2283 | Yes |
| 18 | Aph1a | 10622 | -0.363 | -0.1968 | Yes |
| 19 | Tcf7l2 | 10725 | -0.374 | -0.1532 | Yes |
| 20 | Arrb1 | 11139 | -0.428 | -0.1272 | Yes |
| 21 | Rbx1 | 11726 | -0.538 | -0.0998 | Yes |
| 22 | Psenen | 11774 | -0.548 | -0.0276 | Yes |
| 23 | Dtx2 | 11895 | -0.586 | 0.0440 | Yes |