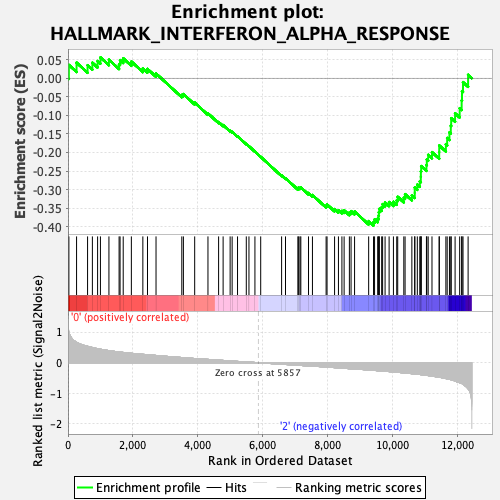
Profile of the Running ES Score & Positions of GeneSet Members on the Rank Ordered List
| Dataset | Mast.Mast_Pheno.cls #Group1_versus_Group3.Mast_Pheno.cls #Group1_versus_Group3_repos |
| Phenotype | Mast_Pheno.cls#Group1_versus_Group3_repos |
| Upregulated in class | 2 |
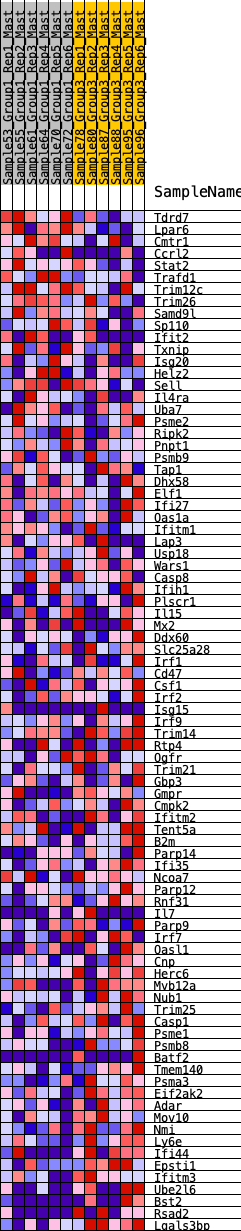
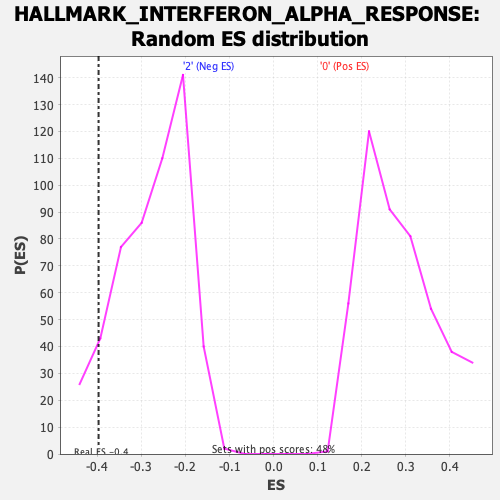
| GeneSet | HALLMARK_INTERFERON_ALPHA_RESPONSE |
| Enrichment Score (ES) | -0.3970262 |
| Normalized Enrichment Score (NES) | -1.4412313 |
| Nominal p-value | 0.08190476 |
| FDR q-value | 0.7684179 |
| FWER p-Value | 0.404 |
| SYMBOL | RANK IN GENE LIST | RANK METRIC SCORE | RUNNING ES | CORE ENRICHMENT | |
|---|---|---|---|---|---|
| 1 | Tdrd7 | 27 | 0.999 | 0.0358 | No |
| 2 | Lpar6 | 264 | 0.665 | 0.0420 | No |
| 3 | Cmtr1 | 603 | 0.535 | 0.0350 | No |
| 4 | Ccrl2 | 751 | 0.494 | 0.0418 | No |
| 5 | Stat2 | 912 | 0.457 | 0.0463 | No |
| 6 | Trafd1 | 999 | 0.441 | 0.0560 | No |
| 7 | Trim12c | 1261 | 0.394 | 0.0499 | No |
| 8 | Trim26 | 1574 | 0.348 | 0.0379 | No |
| 9 | Samd9l | 1604 | 0.346 | 0.0487 | No |
| 10 | Sp110 | 1701 | 0.334 | 0.0536 | No |
| 11 | Ifit2 | 1952 | 0.305 | 0.0450 | No |
| 12 | Txnip | 2306 | 0.272 | 0.0267 | No |
| 13 | Isg20 | 2449 | 0.259 | 0.0251 | No |
| 14 | Helz2 | 2712 | 0.235 | 0.0128 | No |
| 15 | Sell | 3506 | 0.168 | -0.0450 | No |
| 16 | Il4ra | 3555 | 0.163 | -0.0427 | No |
| 17 | Uba7 | 3903 | 0.135 | -0.0657 | No |
| 18 | Psme2 | 4312 | 0.107 | -0.0946 | No |
| 19 | Ripk2 | 4640 | 0.083 | -0.1179 | No |
| 20 | Pnpt1 | 4779 | 0.073 | -0.1263 | No |
| 21 | Psmb9 | 4995 | 0.056 | -0.1416 | No |
| 22 | Tap1 | 5057 | 0.053 | -0.1445 | No |
| 23 | Dhx58 | 5223 | 0.041 | -0.1563 | No |
| 24 | Elf1 | 5493 | 0.022 | -0.1772 | No |
| 25 | Ifi27 | 5575 | 0.017 | -0.1831 | No |
| 26 | Oas1a | 5759 | 0.006 | -0.1977 | No |
| 27 | Ifitm1 | 5937 | -0.005 | -0.2118 | No |
| 28 | Lap3 | 6581 | -0.050 | -0.2620 | No |
| 29 | Usp18 | 6701 | -0.058 | -0.2694 | No |
| 30 | Wars1 | 7084 | -0.084 | -0.2971 | No |
| 31 | Casp8 | 7097 | -0.085 | -0.2948 | No |
| 32 | Ifih1 | 7145 | -0.089 | -0.2953 | No |
| 33 | Plscr1 | 7173 | -0.090 | -0.2940 | No |
| 34 | Il15 | 7410 | -0.104 | -0.3092 | No |
| 35 | Mx2 | 7531 | -0.112 | -0.3146 | No |
| 36 | Ddx60 | 7952 | -0.142 | -0.3432 | No |
| 37 | Slc25a28 | 7981 | -0.144 | -0.3400 | No |
| 38 | Irf1 | 8213 | -0.161 | -0.3526 | No |
| 39 | Cd47 | 8332 | -0.170 | -0.3557 | No |
| 40 | Csf1 | 8439 | -0.178 | -0.3575 | No |
| 41 | Irf2 | 8507 | -0.183 | -0.3560 | No |
| 42 | Isg15 | 8669 | -0.195 | -0.3616 | No |
| 43 | Irf9 | 8721 | -0.199 | -0.3582 | No |
| 44 | Trim14 | 8829 | -0.206 | -0.3590 | No |
| 45 | Rtp4 | 9263 | -0.238 | -0.3850 | No |
| 46 | Ogfr | 9413 | -0.250 | -0.3875 | Yes |
| 47 | Trim21 | 9445 | -0.252 | -0.3805 | Yes |
| 48 | Gbp3 | 9541 | -0.262 | -0.3782 | Yes |
| 49 | Gmpr | 9570 | -0.264 | -0.3704 | Yes |
| 50 | Cmpk2 | 9577 | -0.265 | -0.3608 | Yes |
| 51 | Ifitm2 | 9592 | -0.266 | -0.3519 | Yes |
| 52 | Tent5a | 9664 | -0.270 | -0.3474 | Yes |
| 53 | B2m | 9693 | -0.273 | -0.3393 | Yes |
| 54 | Parp14 | 9769 | -0.280 | -0.3347 | Yes |
| 55 | Ifi35 | 9893 | -0.291 | -0.3336 | Yes |
| 56 | Ncoa7 | 10026 | -0.302 | -0.3328 | Yes |
| 57 | Parp12 | 10128 | -0.311 | -0.3292 | Yes |
| 58 | Rnf31 | 10158 | -0.315 | -0.3195 | Yes |
| 59 | Il7 | 10346 | -0.332 | -0.3221 | Yes |
| 60 | Parp9 | 10385 | -0.335 | -0.3124 | Yes |
| 61 | Irf7 | 10594 | -0.359 | -0.3156 | Yes |
| 62 | Oasl1 | 10683 | -0.369 | -0.3087 | Yes |
| 63 | Cnp | 10684 | -0.369 | -0.2946 | Yes |
| 64 | Herc6 | 10762 | -0.377 | -0.2865 | Yes |
| 65 | Mvb12a | 10838 | -0.386 | -0.2779 | Yes |
| 66 | Nub1 | 10870 | -0.390 | -0.2656 | Yes |
| 67 | Trim25 | 10872 | -0.390 | -0.2509 | Yes |
| 68 | Casp1 | 10882 | -0.391 | -0.2367 | Yes |
| 69 | Psme1 | 11043 | -0.413 | -0.2340 | Yes |
| 70 | Psmb8 | 11055 | -0.414 | -0.2191 | Yes |
| 71 | Batf2 | 11097 | -0.421 | -0.2064 | Yes |
| 72 | Tmem140 | 11214 | -0.439 | -0.1991 | Yes |
| 73 | Psma3 | 11436 | -0.474 | -0.1990 | Yes |
| 74 | Eif2ak2 | 11438 | -0.474 | -0.1811 | Yes |
| 75 | Adar | 11642 | -0.518 | -0.1778 | Yes |
| 76 | Mov10 | 11682 | -0.527 | -0.1610 | Yes |
| 77 | Nmi | 11752 | -0.545 | -0.1459 | Yes |
| 78 | Ly6e | 11794 | -0.554 | -0.1281 | Yes |
| 79 | Ifi44 | 11806 | -0.559 | -0.1077 | Yes |
| 80 | Epsti1 | 11926 | -0.602 | -0.0945 | Yes |
| 81 | Ifitm3 | 12067 | -0.656 | -0.0809 | Yes |
| 82 | Ube2l6 | 12128 | -0.678 | -0.0600 | Yes |
| 83 | Bst2 | 12139 | -0.683 | -0.0348 | Yes |
| 84 | Rsad2 | 12170 | -0.701 | -0.0106 | Yes |
| 85 | Lgals3bp | 12327 | -0.854 | 0.0092 | Yes |