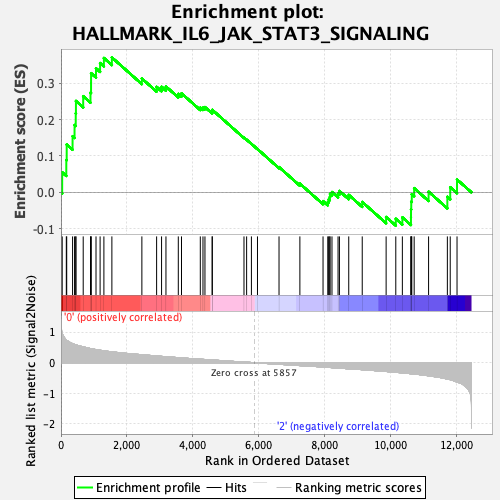
Profile of the Running ES Score & Positions of GeneSet Members on the Rank Ordered List
| Dataset | Mast.Mast_Pheno.cls #Group1_versus_Group3.Mast_Pheno.cls #Group1_versus_Group3_repos |
| Phenotype | Mast_Pheno.cls#Group1_versus_Group3_repos |
| Upregulated in class | 0 |
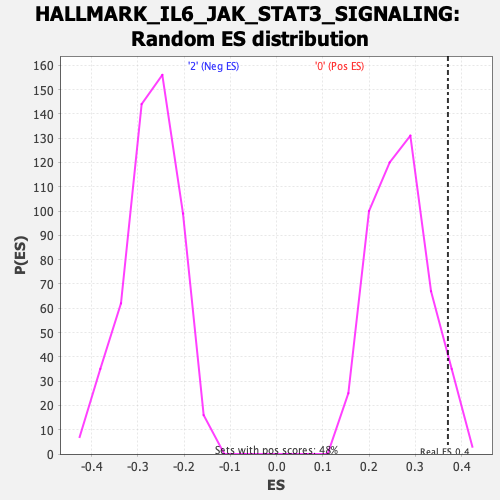
| GeneSet | HALLMARK_IL6_JAK_STAT3_SIGNALING |
| Enrichment Score (ES) | 0.37026003 |
| Normalized Enrichment Score (NES) | 1.3959736 |
| Nominal p-value | 0.045738045 |
| FDR q-value | 0.38182914 |
| FWER p-Value | 0.567 |
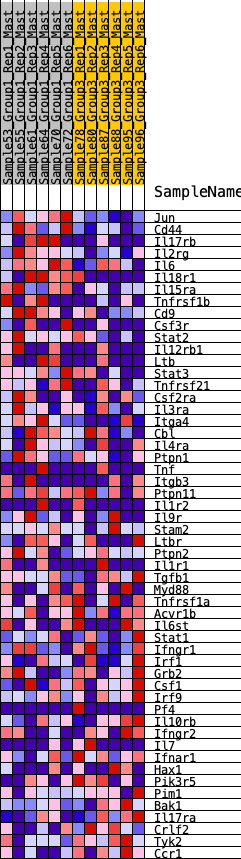
| SYMBOL | RANK IN GENE LIST | RANK METRIC SCORE | RUNNING ES | CORE ENRICHMENT | |
|---|---|---|---|---|---|
| 1 | Jun | 36 | 0.971 | 0.0551 | Yes |
| 2 | Cd44 | 161 | 0.734 | 0.0889 | Yes |
| 3 | Il17rb | 173 | 0.725 | 0.1313 | Yes |
| 4 | Il2rg | 351 | 0.619 | 0.1540 | Yes |
| 5 | Il6 | 411 | 0.596 | 0.1848 | Yes |
| 6 | Il18r1 | 447 | 0.581 | 0.2167 | Yes |
| 7 | Il15ra | 453 | 0.579 | 0.2508 | Yes |
| 8 | Tnfrsf1b | 673 | 0.513 | 0.2638 | Yes |
| 9 | Cd9 | 894 | 0.462 | 0.2736 | Yes |
| 10 | Csf3r | 911 | 0.457 | 0.2996 | Yes |
| 11 | Stat2 | 912 | 0.457 | 0.3269 | Yes |
| 12 | Il12rb1 | 1061 | 0.426 | 0.3404 | Yes |
| 13 | Ltb | 1185 | 0.406 | 0.3547 | Yes |
| 14 | Stat3 | 1300 | 0.387 | 0.3686 | Yes |
| 15 | Tnfrsf21 | 1542 | 0.353 | 0.3703 | Yes |
| 16 | Csf2ra | 2451 | 0.258 | 0.3124 | No |
| 17 | Il3ra | 2898 | 0.218 | 0.2894 | No |
| 18 | Itga4 | 3048 | 0.205 | 0.2896 | No |
| 19 | Cbl | 3181 | 0.194 | 0.2906 | No |
| 20 | Il4ra | 3555 | 0.163 | 0.2702 | No |
| 21 | Ptpn1 | 3652 | 0.156 | 0.2718 | No |
| 22 | Tnf | 4222 | 0.113 | 0.2326 | No |
| 23 | Itgb3 | 4303 | 0.107 | 0.2325 | No |
| 24 | Ptpn11 | 4363 | 0.103 | 0.2339 | No |
| 25 | Il1r2 | 4581 | 0.087 | 0.2216 | No |
| 26 | Il9r | 4586 | 0.086 | 0.2264 | No |
| 27 | Stam2 | 5546 | 0.019 | 0.1501 | No |
| 28 | Ltbr | 5626 | 0.014 | 0.1446 | No |
| 29 | Ptpn2 | 5771 | 0.005 | 0.1333 | No |
| 30 | Il1r1 | 5955 | -0.007 | 0.1189 | No |
| 31 | Tgfb1 | 6608 | -0.052 | 0.0694 | No |
| 32 | Myd88 | 7240 | -0.095 | 0.0241 | No |
| 33 | Tnfrsf1a | 7942 | -0.141 | -0.0241 | No |
| 34 | Acvr1b | 8086 | -0.152 | -0.0265 | No |
| 35 | Il6st | 8112 | -0.153 | -0.0194 | No |
| 36 | Stat1 | 8146 | -0.156 | -0.0128 | No |
| 37 | Ifngr1 | 8154 | -0.156 | -0.0040 | No |
| 38 | Irf1 | 8213 | -0.161 | 0.0009 | No |
| 39 | Grb2 | 8397 | -0.174 | -0.0034 | No |
| 40 | Csf1 | 8439 | -0.178 | 0.0039 | No |
| 41 | Irf9 | 8721 | -0.199 | -0.0069 | No |
| 42 | Pf4 | 9130 | -0.227 | -0.0263 | No |
| 43 | Il10rb | 9854 | -0.287 | -0.0675 | No |
| 44 | Ifngr2 | 10147 | -0.313 | -0.0724 | No |
| 45 | Il7 | 10346 | -0.332 | -0.0685 | No |
| 46 | Ifnar1 | 10607 | -0.361 | -0.0680 | No |
| 47 | Hax1 | 10609 | -0.361 | -0.0465 | No |
| 48 | Pik3r5 | 10616 | -0.362 | -0.0254 | No |
| 49 | Pim1 | 10632 | -0.364 | -0.0049 | No |
| 50 | Bak1 | 10704 | -0.372 | 0.0116 | No |
| 51 | Il17ra | 11141 | -0.428 | 0.0020 | No |
| 52 | Crlf2 | 11710 | -0.533 | -0.0121 | No |
| 53 | Tyk2 | 11797 | -0.555 | 0.0141 | No |
| 54 | Ccr1 | 12003 | -0.632 | 0.0354 | No |