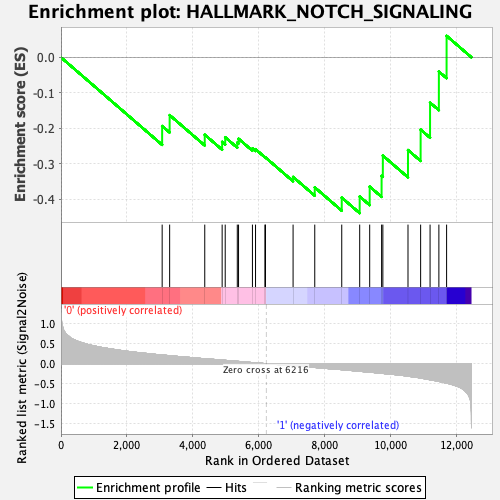
Profile of the Running ES Score & Positions of GeneSet Members on the Rank Ordered List
| Dataset | Mast.Mast_Pheno.cls #Group1_versus_Group2.Mast_Pheno.cls #Group1_versus_Group2_repos |
| Phenotype | Mast_Pheno.cls#Group1_versus_Group2_repos |
| Upregulated in class | 1 |
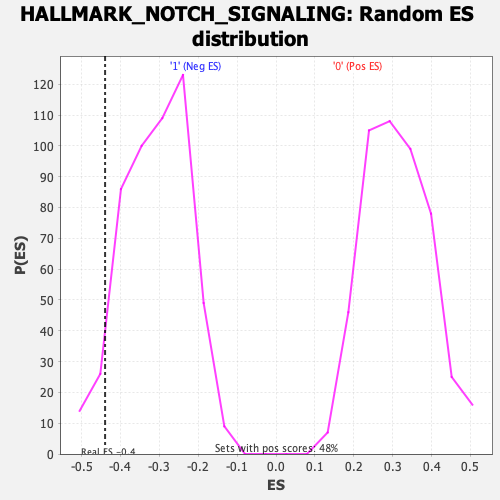
| GeneSet | HALLMARK_NOTCH_SIGNALING |
| Enrichment Score (ES) | -0.43949455 |
| Normalized Enrichment Score (NES) | -1.4163345 |
| Nominal p-value | 0.07170542 |
| FDR q-value | 0.27819255 |
| FWER p-Value | 0.489 |
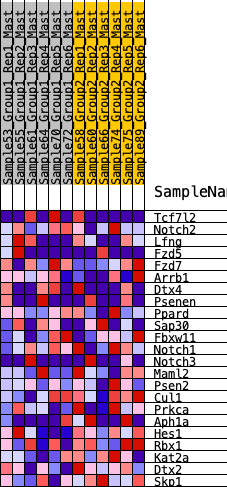
| SYMBOL | RANK IN GENE LIST | RANK METRIC SCORE | RUNNING ES | CORE ENRICHMENT | |
|---|---|---|---|---|---|
| 1 | Tcf7l2 | 3066 | 0.216 | -0.1937 | No |
| 2 | Notch2 | 3293 | 0.199 | -0.1629 | No |
| 3 | Lfng | 4357 | 0.123 | -0.2182 | No |
| 4 | Fzd5 | 4884 | 0.090 | -0.2383 | No |
| 5 | Fzd7 | 4977 | 0.082 | -0.2255 | No |
| 6 | Arrb1 | 5343 | 0.059 | -0.2404 | No |
| 7 | Dtx4 | 5381 | 0.056 | -0.2296 | No |
| 8 | Psenen | 5802 | 0.027 | -0.2568 | No |
| 9 | Ppard | 5896 | 0.021 | -0.2591 | No |
| 10 | Sap30 | 6180 | 0.002 | -0.2814 | No |
| 11 | Fbxw11 | 6198 | 0.001 | -0.2825 | No |
| 12 | Notch1 | 7034 | -0.050 | -0.3373 | No |
| 13 | Notch3 | 7691 | -0.095 | -0.3668 | No |
| 14 | Maml2 | 8509 | -0.149 | -0.3958 | Yes |
| 15 | Psen2 | 9053 | -0.190 | -0.3926 | Yes |
| 16 | Cul1 | 9356 | -0.212 | -0.3647 | Yes |
| 17 | Prkca | 9717 | -0.241 | -0.3343 | Yes |
| 18 | Aph1a | 9755 | -0.244 | -0.2772 | Yes |
| 19 | Hes1 | 10517 | -0.312 | -0.2615 | Yes |
| 20 | Rbx1 | 10900 | -0.359 | -0.2038 | Yes |
| 21 | Kat2a | 11186 | -0.402 | -0.1277 | Yes |
| 22 | Dtx2 | 11453 | -0.443 | -0.0400 | Yes |
| 23 | Skp1 | 11687 | -0.485 | 0.0607 | Yes |