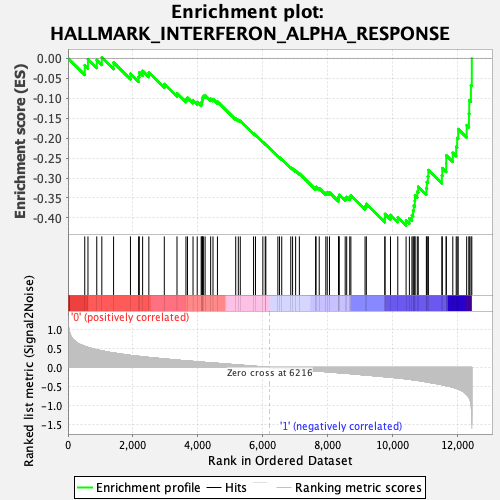
Profile of the Running ES Score & Positions of GeneSet Members on the Rank Ordered List
| Dataset | Mast.Mast_Pheno.cls #Group1_versus_Group2.Mast_Pheno.cls #Group1_versus_Group2_repos |
| Phenotype | Mast_Pheno.cls#Group1_versus_Group2_repos |
| Upregulated in class | 1 |
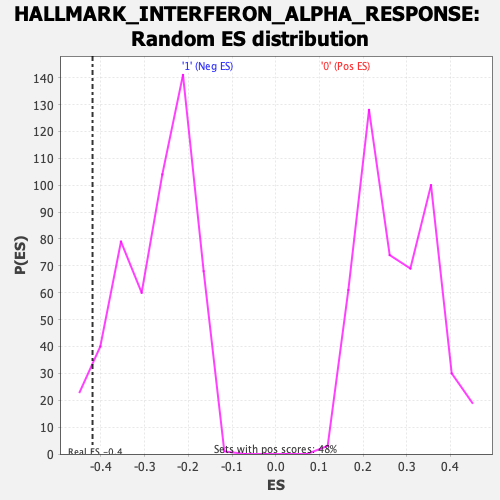
| GeneSet | HALLMARK_INTERFERON_ALPHA_RESPONSE |
| Enrichment Score (ES) | -0.4191931 |
| Normalized Enrichment Score (NES) | -1.5271068 |
| Nominal p-value | 0.0503876 |
| FDR q-value | 0.29976106 |
| FWER p-Value | 0.242 |
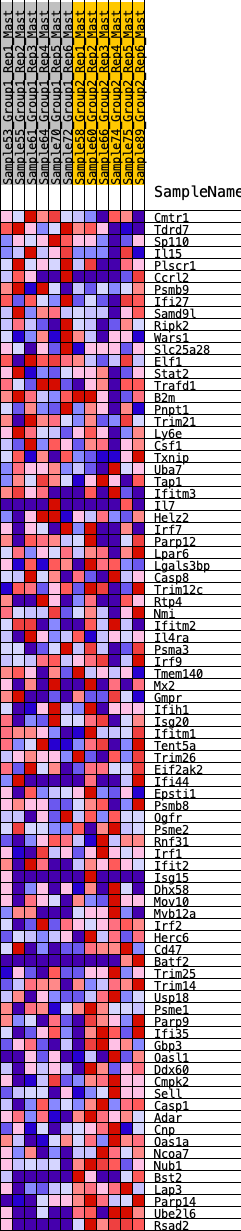
| SYMBOL | RANK IN GENE LIST | RANK METRIC SCORE | RUNNING ES | CORE ENRICHMENT | |
|---|---|---|---|---|---|
| 1 | Cmtr1 | 516 | 0.557 | -0.0176 | No |
| 2 | Tdrd7 | 615 | 0.528 | -0.0026 | No |
| 3 | Sp110 | 886 | 0.464 | -0.0043 | No |
| 4 | Il15 | 1042 | 0.436 | 0.0020 | No |
| 5 | Plscr1 | 1404 | 0.382 | -0.0106 | No |
| 6 | Ccrl2 | 1924 | 0.316 | -0.0389 | No |
| 7 | Psmb9 | 2175 | 0.291 | -0.0465 | No |
| 8 | Ifi27 | 2196 | 0.290 | -0.0355 | No |
| 9 | Samd9l | 2299 | 0.280 | -0.0317 | No |
| 10 | Ripk2 | 2491 | 0.263 | -0.0357 | No |
| 11 | Wars1 | 2967 | 0.222 | -0.0645 | No |
| 12 | Slc25a28 | 3358 | 0.193 | -0.0877 | No |
| 13 | Elf1 | 3634 | 0.173 | -0.1024 | No |
| 14 | Stat2 | 3681 | 0.170 | -0.0988 | No |
| 15 | Trafd1 | 3852 | 0.158 | -0.1057 | No |
| 16 | B2m | 3981 | 0.148 | -0.1096 | No |
| 17 | Pnpt1 | 4103 | 0.141 | -0.1133 | No |
| 18 | Trim21 | 4125 | 0.139 | -0.1090 | No |
| 19 | Ly6e | 4136 | 0.138 | -0.1038 | No |
| 20 | Csf1 | 4145 | 0.138 | -0.0984 | No |
| 21 | Txnip | 4171 | 0.136 | -0.0945 | No |
| 22 | Uba7 | 4224 | 0.131 | -0.0931 | No |
| 23 | Tap1 | 4395 | 0.121 | -0.1016 | No |
| 24 | Ifitm3 | 4467 | 0.115 | -0.1023 | No |
| 25 | Il7 | 4604 | 0.107 | -0.1087 | No |
| 26 | Helz2 | 5167 | 0.069 | -0.1512 | No |
| 27 | Irf7 | 5247 | 0.065 | -0.1547 | No |
| 28 | Parp12 | 5308 | 0.060 | -0.1570 | No |
| 29 | Lpar6 | 5717 | 0.032 | -0.1886 | No |
| 30 | Lgals3bp | 5776 | 0.028 | -0.1921 | No |
| 31 | Casp8 | 6003 | 0.014 | -0.2097 | No |
| 32 | Trim12c | 6076 | 0.009 | -0.2152 | No |
| 33 | Rtp4 | 6095 | 0.008 | -0.2163 | No |
| 34 | Nmi | 6466 | -0.015 | -0.2456 | No |
| 35 | Ifitm2 | 6517 | -0.019 | -0.2488 | No |
| 36 | Il4ra | 6585 | -0.024 | -0.2532 | No |
| 37 | Psma3 | 6863 | -0.038 | -0.2740 | No |
| 38 | Irf9 | 6919 | -0.042 | -0.2766 | No |
| 39 | Tmem140 | 7013 | -0.049 | -0.2820 | No |
| 40 | Mx2 | 7128 | -0.057 | -0.2888 | No |
| 41 | Gmpr | 7628 | -0.091 | -0.3252 | No |
| 42 | Ifih1 | 7642 | -0.092 | -0.3223 | No |
| 43 | Isg20 | 7740 | -0.098 | -0.3259 | No |
| 44 | Ifitm1 | 7943 | -0.112 | -0.3374 | No |
| 45 | Tent5a | 7987 | -0.115 | -0.3359 | No |
| 46 | Trim26 | 8056 | -0.119 | -0.3362 | No |
| 47 | Eif2ak2 | 8334 | -0.137 | -0.3526 | No |
| 48 | Ifi44 | 8340 | -0.138 | -0.3471 | No |
| 49 | Epsti1 | 8356 | -0.139 | -0.3422 | No |
| 50 | Psmb8 | 8540 | -0.151 | -0.3505 | No |
| 51 | Ogfr | 8586 | -0.155 | -0.3474 | No |
| 52 | Psme2 | 8680 | -0.161 | -0.3480 | No |
| 53 | Rnf31 | 8715 | -0.163 | -0.3437 | No |
| 54 | Irf1 | 9152 | -0.197 | -0.3704 | No |
| 55 | Ifit2 | 9192 | -0.200 | -0.3649 | No |
| 56 | Isg15 | 9762 | -0.244 | -0.4003 | No |
| 57 | Dhx58 | 9766 | -0.244 | -0.3900 | No |
| 58 | Mov10 | 9936 | -0.257 | -0.3925 | No |
| 59 | Mvb12a | 10160 | -0.277 | -0.3986 | No |
| 60 | Irf2 | 10416 | -0.300 | -0.4062 | Yes |
| 61 | Herc6 | 10518 | -0.312 | -0.4008 | Yes |
| 62 | Cd47 | 10596 | -0.321 | -0.3931 | Yes |
| 63 | Batf2 | 10631 | -0.325 | -0.3817 | Yes |
| 64 | Trim25 | 10654 | -0.328 | -0.3693 | Yes |
| 65 | Trim14 | 10685 | -0.331 | -0.3574 | Yes |
| 66 | Usp18 | 10691 | -0.331 | -0.3434 | Yes |
| 67 | Psme1 | 10760 | -0.339 | -0.3342 | Yes |
| 68 | Parp9 | 10790 | -0.343 | -0.3216 | Yes |
| 69 | Ifi35 | 11041 | -0.379 | -0.3254 | Yes |
| 70 | Gbp3 | 11056 | -0.381 | -0.3101 | Yes |
| 71 | Oasl1 | 11088 | -0.386 | -0.2959 | Yes |
| 72 | Ddx60 | 11102 | -0.388 | -0.2801 | Yes |
| 73 | Cmpk2 | 11518 | -0.454 | -0.2940 | Yes |
| 74 | Sell | 11532 | -0.456 | -0.2753 | Yes |
| 75 | Casp1 | 11652 | -0.480 | -0.2641 | Yes |
| 76 | Adar | 11653 | -0.480 | -0.2433 | Yes |
| 77 | Cnp | 11855 | -0.522 | -0.2369 | Yes |
| 78 | Oas1a | 11960 | -0.549 | -0.2215 | Yes |
| 79 | Ncoa7 | 11990 | -0.559 | -0.1996 | Yes |
| 80 | Nub1 | 12021 | -0.567 | -0.1774 | Yes |
| 81 | Bst2 | 12283 | -0.713 | -0.1676 | Yes |
| 82 | Lap3 | 12352 | -0.784 | -0.1391 | Yes |
| 83 | Parp14 | 12362 | -0.804 | -0.1050 | Yes |
| 84 | Ube2l6 | 12414 | -0.955 | -0.0677 | Yes |
| 85 | Rsad2 | 12441 | -1.609 | 0.0000 | Yes |