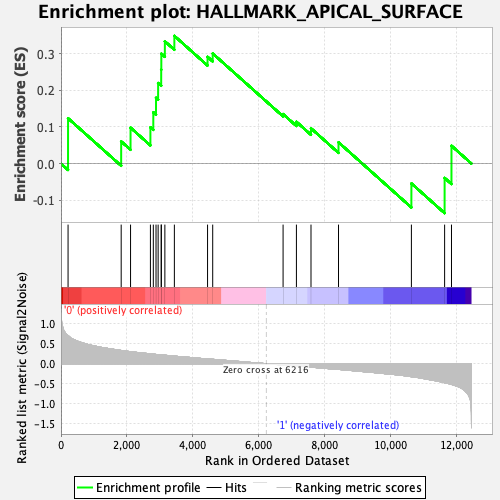
Profile of the Running ES Score & Positions of GeneSet Members on the Rank Ordered List
| Dataset | Mast.Mast_Pheno.cls #Group1_versus_Group2.Mast_Pheno.cls #Group1_versus_Group2_repos |
| Phenotype | Mast_Pheno.cls#Group1_versus_Group2_repos |
| Upregulated in class | 0 |
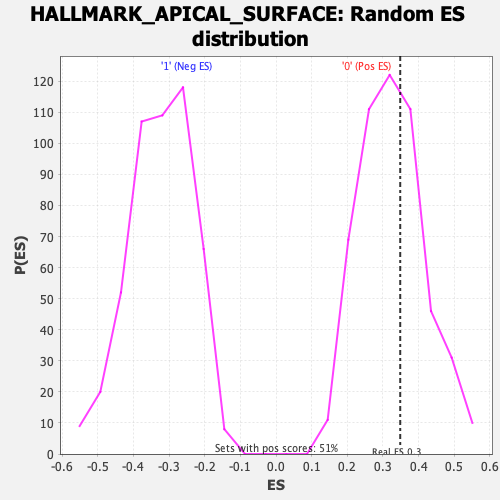
| GeneSet | HALLMARK_APICAL_SURFACE |
| Enrichment Score (ES) | 0.34848747 |
| Normalized Enrichment Score (NES) | 1.0700735 |
| Nominal p-value | 0.3776908 |
| FDR q-value | 1.0 |
| FWER p-Value | 0.976 |
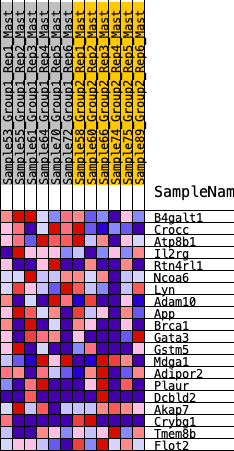
| SYMBOL | RANK IN GENE LIST | RANK METRIC SCORE | RUNNING ES | CORE ENRICHMENT | |
|---|---|---|---|---|---|
| 1 | B4galt1 | 214 | 0.698 | 0.1237 | Yes |
| 2 | Crocc | 1824 | 0.329 | 0.0606 | Yes |
| 3 | Atp8b1 | 2108 | 0.299 | 0.0981 | Yes |
| 4 | Il2rg | 2710 | 0.245 | 0.0991 | Yes |
| 5 | Rtn4rl1 | 2798 | 0.237 | 0.1399 | Yes |
| 6 | Ncoa6 | 2880 | 0.229 | 0.1796 | Yes |
| 7 | Lyn | 2944 | 0.224 | 0.2198 | Yes |
| 8 | Adam10 | 3037 | 0.218 | 0.2564 | Yes |
| 9 | App | 3041 | 0.217 | 0.3000 | Yes |
| 10 | Brca1 | 3148 | 0.209 | 0.3337 | Yes |
| 11 | Gata3 | 3436 | 0.188 | 0.3485 | Yes |
| 12 | Gstm5 | 4442 | 0.117 | 0.2912 | No |
| 13 | Mdga1 | 4598 | 0.107 | 0.3005 | No |
| 14 | Adipor2 | 6731 | -0.031 | 0.1352 | No |
| 15 | Plaur | 7135 | -0.057 | 0.1142 | No |
| 16 | Dcbld2 | 7577 | -0.088 | 0.0964 | No |
| 17 | Akap7 | 8411 | -0.143 | 0.0582 | No |
| 18 | Crybg1 | 10620 | -0.325 | -0.0540 | No |
| 19 | Tmem8b | 11627 | -0.476 | -0.0390 | No |
| 20 | Flot2 | 11835 | -0.517 | 0.0488 | No |