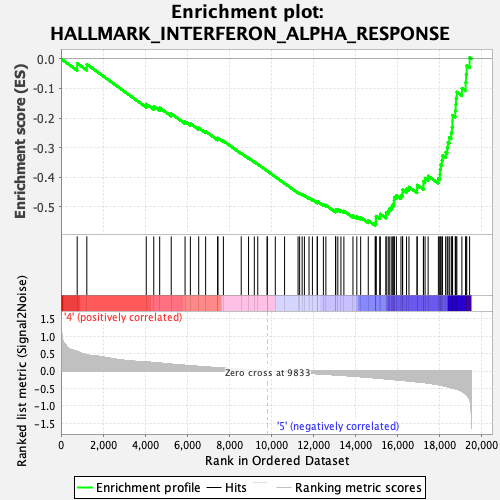
Profile of the Running ES Score & Positions of GeneSet Members on the Rank Ordered List
| Dataset | MPP.MPP_Pheno.cls#Group6_versus_Group8.MPP_Pheno.cls#Group6_versus_Group8_repos |
| Phenotype | MPP_Pheno.cls#Group6_versus_Group8_repos |
| Upregulated in class | 5 |
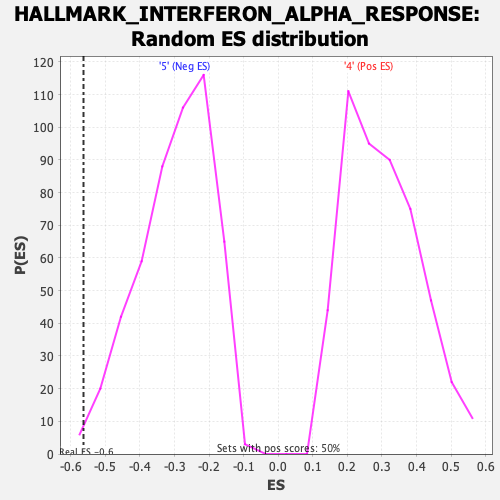
| GeneSet | HALLMARK_INTERFERON_ALPHA_RESPONSE |
| Enrichment Score (ES) | -0.5632294 |
| Normalized Enrichment Score (NES) | -1.8964647 |
| Nominal p-value | 0.00990099 |
| FDR q-value | 0.012270983 |
| FWER p-Value | 0.021 |
| SYMBOL | RANK IN GENE LIST | RANK METRIC SCORE | RUNNING ES | CORE ENRICHMENT | |
|---|---|---|---|---|---|
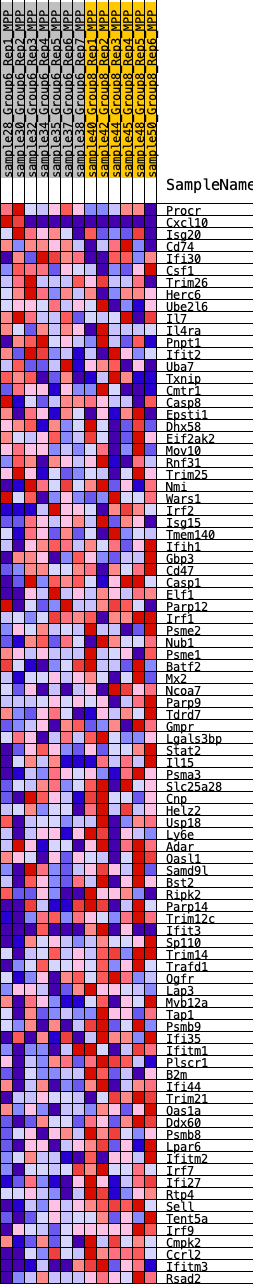
| 1 | Procr | 770 | 0.560 | -0.0153 | No |
| 2 | Cxcl10 | 1227 | 0.464 | -0.0185 | No |
| 3 | Isg20 | 4052 | 0.251 | -0.1530 | No |
| 4 | Cd74 | 4409 | 0.237 | -0.1609 | No |
| 5 | Ifi30 | 4691 | 0.225 | -0.1656 | No |
| 6 | Csf1 | 5240 | 0.193 | -0.1854 | No |
| 7 | Trim26 | 5897 | 0.161 | -0.2122 | No |
| 8 | Herc6 | 6150 | 0.148 | -0.2187 | No |
| 9 | Ube2l6 | 6546 | 0.130 | -0.2334 | No |
| 10 | Il7 | 6875 | 0.115 | -0.2453 | No |
| 11 | Il4ra | 7444 | 0.090 | -0.2706 | No |
| 12 | Pnpt1 | 7461 | 0.090 | -0.2675 | No |
| 13 | Ifit2 | 7719 | 0.080 | -0.2772 | No |
| 14 | Uba7 | 8567 | 0.048 | -0.3188 | No |
| 15 | Txnip | 8915 | 0.035 | -0.3351 | No |
| 16 | Cmtr1 | 9189 | 0.024 | -0.3481 | No |
| 17 | Casp8 | 9353 | 0.018 | -0.3557 | No |
| 18 | Epsti1 | 9797 | 0.001 | -0.3785 | No |
| 19 | Dhx58 | 9809 | 0.001 | -0.3790 | No |
| 20 | Eif2ak2 | 10187 | -0.000 | -0.3984 | No |
| 21 | Mov10 | 10627 | -0.014 | -0.4205 | No |
| 22 | Rnf31 | 11269 | -0.038 | -0.4518 | No |
| 23 | Trim25 | 11343 | -0.041 | -0.4538 | No |
| 24 | Nmi | 11463 | -0.045 | -0.4580 | No |
| 25 | Wars1 | 11570 | -0.048 | -0.4613 | No |
| 26 | Irf2 | 11790 | -0.057 | -0.4701 | No |
| 27 | Isg15 | 11951 | -0.063 | -0.4756 | No |
| 28 | Tmem140 | 12183 | -0.073 | -0.4843 | No |
| 29 | Ifih1 | 12184 | -0.073 | -0.4811 | No |
| 30 | Gbp3 | 12473 | -0.083 | -0.4923 | No |
| 31 | Cd47 | 12590 | -0.087 | -0.4945 | No |
| 32 | Casp1 | 13050 | -0.106 | -0.5135 | No |
| 33 | Elf1 | 13061 | -0.106 | -0.5093 | No |
| 34 | Parp12 | 13159 | -0.110 | -0.5096 | No |
| 35 | Irf1 | 13306 | -0.116 | -0.5120 | No |
| 36 | Psme2 | 13447 | -0.121 | -0.5140 | No |
| 37 | Nub1 | 13878 | -0.141 | -0.5300 | No |
| 38 | Psme1 | 14061 | -0.148 | -0.5329 | No |
| 39 | Batf2 | 14244 | -0.157 | -0.5354 | No |
| 40 | Mx2 | 14606 | -0.174 | -0.5464 | No |
| 41 | Ncoa7 | 14934 | -0.192 | -0.5549 | Yes |
| 42 | Parp9 | 14967 | -0.194 | -0.5480 | Yes |
| 43 | Tdrd7 | 14969 | -0.194 | -0.5396 | Yes |
| 44 | Gmpr | 14973 | -0.194 | -0.5313 | Yes |
| 45 | Lgals3bp | 15151 | -0.204 | -0.5315 | Yes |
| 46 | Stat2 | 15178 | -0.205 | -0.5240 | Yes |
| 47 | Il15 | 15451 | -0.219 | -0.5284 | Yes |
| 48 | Psma3 | 15452 | -0.219 | -0.5188 | Yes |
| 49 | Slc25a28 | 15552 | -0.225 | -0.5141 | Yes |
| 50 | Cnp | 15602 | -0.227 | -0.5068 | Yes |
| 51 | Helz2 | 15693 | -0.233 | -0.5012 | Yes |
| 52 | Usp18 | 15750 | -0.236 | -0.4939 | Yes |
| 53 | Ly6e | 15822 | -0.240 | -0.4871 | Yes |
| 54 | Adar | 15829 | -0.240 | -0.4769 | Yes |
| 55 | Oasl1 | 15843 | -0.241 | -0.4670 | Yes |
| 56 | Samd9l | 15944 | -0.248 | -0.4614 | Yes |
| 57 | Bst2 | 16160 | -0.261 | -0.4611 | Yes |
| 58 | Ripk2 | 16236 | -0.266 | -0.4534 | Yes |
| 59 | Parp14 | 16238 | -0.266 | -0.4418 | Yes |
| 60 | Trim12c | 16426 | -0.273 | -0.4395 | Yes |
| 61 | Ifit3 | 16540 | -0.282 | -0.4331 | Yes |
| 62 | Sp110 | 16925 | -0.306 | -0.4395 | Yes |
| 63 | Trim14 | 16929 | -0.306 | -0.4263 | Yes |
| 64 | Trafd1 | 17228 | -0.325 | -0.4275 | Yes |
| 65 | Ogfr | 17229 | -0.325 | -0.4133 | Yes |
| 66 | Lap3 | 17306 | -0.327 | -0.4030 | Yes |
| 67 | Mvb12a | 17452 | -0.340 | -0.3957 | Yes |
| 68 | Tap1 | 17939 | -0.385 | -0.4039 | Yes |
| 69 | Psmb9 | 18007 | -0.394 | -0.3901 | Yes |
| 70 | Ifi35 | 18018 | -0.395 | -0.3734 | Yes |
| 71 | Ifitm1 | 18054 | -0.399 | -0.3578 | Yes |
| 72 | Plscr1 | 18106 | -0.405 | -0.3428 | Yes |
| 73 | B2m | 18136 | -0.409 | -0.3265 | Yes |
| 74 | Ifi44 | 18284 | -0.429 | -0.3153 | Yes |
| 75 | Trim21 | 18356 | -0.439 | -0.2998 | Yes |
| 76 | Oas1a | 18391 | -0.445 | -0.2822 | Yes |
| 77 | Ddx60 | 18458 | -0.455 | -0.2657 | Yes |
| 78 | Psmb8 | 18549 | -0.472 | -0.2498 | Yes |
| 79 | Lpar6 | 18584 | -0.477 | -0.2307 | Yes |
| 80 | Ifitm2 | 18611 | -0.478 | -0.2112 | Yes |
| 81 | Irf7 | 18612 | -0.478 | -0.1904 | Yes |
| 82 | Ifi27 | 18741 | -0.503 | -0.1751 | Yes |
| 83 | Rtp4 | 18762 | -0.507 | -0.1540 | Yes |
| 84 | Sell | 18777 | -0.509 | -0.1326 | Yes |
| 85 | Tent5a | 18816 | -0.513 | -0.1121 | Yes |
| 86 | Irf9 | 19056 | -0.577 | -0.0993 | Yes |
| 87 | Cmpk2 | 19233 | -0.654 | -0.0799 | Yes |
| 88 | Ccrl2 | 19255 | -0.670 | -0.0517 | Yes |
| 89 | Ifitm3 | 19286 | -0.688 | -0.0233 | Yes |
| 90 | Rsad2 | 19423 | -0.800 | 0.0046 | Yes |