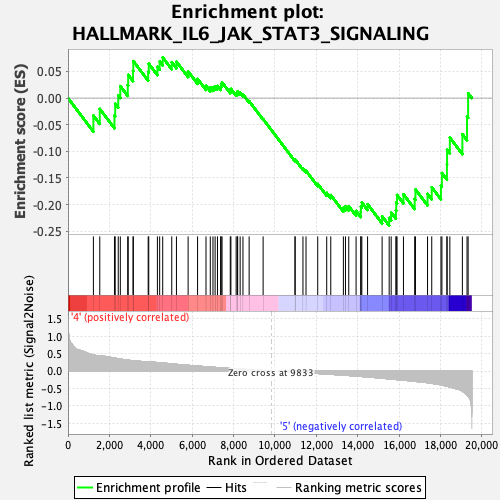
Profile of the Running ES Score & Positions of GeneSet Members on the Rank Ordered List
| Dataset | MPP.MPP_Pheno.cls#Group6_versus_Group8.MPP_Pheno.cls#Group6_versus_Group8_repos |
| Phenotype | MPP_Pheno.cls#Group6_versus_Group8_repos |
| Upregulated in class | 5 |
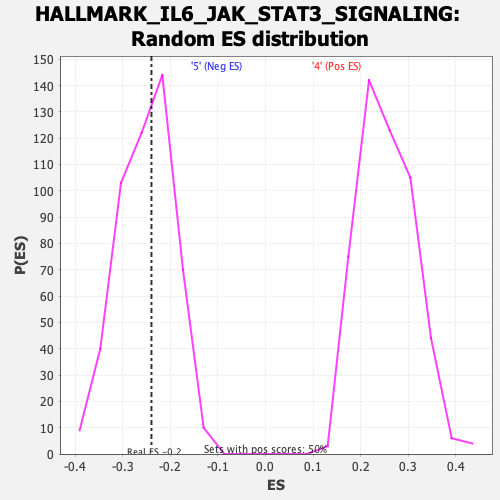
| GeneSet | HALLMARK_IL6_JAK_STAT3_SIGNALING |
| Enrichment Score (ES) | -0.2396311 |
| Normalized Enrichment Score (NES) | -0.9523577 |
| Nominal p-value | 0.53815264 |
| FDR q-value | 0.733179 |
| FWER p-Value | 0.997 |
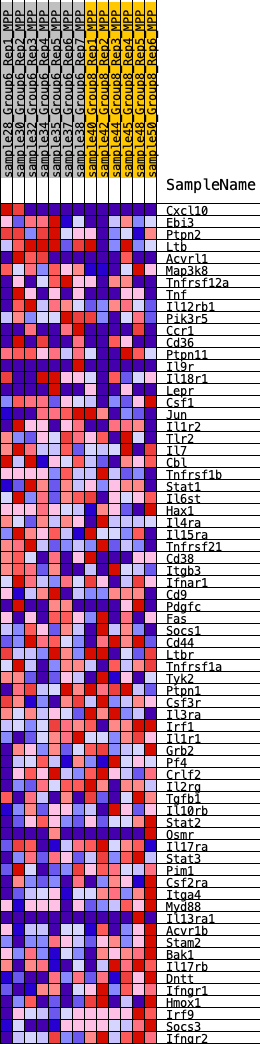
| SYMBOL | RANK IN GENE LIST | RANK METRIC SCORE | RUNNING ES | CORE ENRICHMENT | |
|---|---|---|---|---|---|
| 1 | Cxcl10 | 1227 | 0.464 | -0.0329 | No |
| 2 | Ebi3 | 1535 | 0.435 | -0.0204 | No |
| 3 | Ptpn2 | 2245 | 0.372 | -0.0326 | No |
| 4 | Ltb | 2281 | 0.368 | -0.0104 | No |
| 5 | Acvrl1 | 2428 | 0.353 | 0.0050 | No |
| 6 | Map3k8 | 2528 | 0.345 | 0.0224 | No |
| 7 | Tnfrsf12a | 2887 | 0.313 | 0.0244 | No |
| 8 | Tnf | 2908 | 0.312 | 0.0436 | No |
| 9 | Il12rb1 | 3142 | 0.296 | 0.0509 | No |
| 10 | Pik3r5 | 3157 | 0.295 | 0.0694 | No |
| 11 | Ccr1 | 3874 | 0.257 | 0.0493 | No |
| 12 | Cd36 | 3902 | 0.255 | 0.0646 | No |
| 13 | Ptpn11 | 4320 | 0.243 | 0.0589 | No |
| 14 | Il9r | 4429 | 0.236 | 0.0687 | No |
| 15 | Il18r1 | 4576 | 0.232 | 0.0763 | No |
| 16 | Lepr | 5013 | 0.206 | 0.0674 | No |
| 17 | Csf1 | 5240 | 0.193 | 0.0683 | No |
| 18 | Jun | 5804 | 0.164 | 0.0501 | No |
| 19 | Il1r2 | 6261 | 0.143 | 0.0359 | No |
| 20 | Tlr2 | 6668 | 0.123 | 0.0231 | No |
| 21 | Il7 | 6875 | 0.115 | 0.0200 | No |
| 22 | Cbl | 7005 | 0.110 | 0.0205 | No |
| 23 | Tnfrsf1b | 7108 | 0.105 | 0.0221 | No |
| 24 | Stat1 | 7223 | 0.100 | 0.0227 | No |
| 25 | Il6st | 7374 | 0.093 | 0.0211 | No |
| 26 | Hax1 | 7400 | 0.092 | 0.0258 | No |
| 27 | Il4ra | 7444 | 0.090 | 0.0295 | No |
| 28 | Il15ra | 7841 | 0.075 | 0.0140 | No |
| 29 | Tnfrsf21 | 7871 | 0.074 | 0.0173 | No |
| 30 | Cd38 | 8125 | 0.064 | 0.0085 | No |
| 31 | Itgb3 | 8184 | 0.061 | 0.0095 | No |
| 32 | Ifnar1 | 8198 | 0.061 | 0.0128 | No |
| 33 | Cd9 | 8318 | 0.057 | 0.0103 | No |
| 34 | Pdgfc | 8454 | 0.052 | 0.0068 | No |
| 35 | Fas | 8752 | 0.041 | -0.0058 | No |
| 36 | Socs1 | 9428 | 0.015 | -0.0395 | No |
| 37 | Cd44 | 10970 | -0.027 | -0.1170 | No |
| 38 | Ltbr | 10973 | -0.027 | -0.1154 | No |
| 39 | Tnfrsf1a | 11353 | -0.041 | -0.1322 | No |
| 40 | Tyk2 | 11501 | -0.046 | -0.1367 | No |
| 41 | Ptpn1 | 12066 | -0.069 | -0.1613 | No |
| 42 | Csf3r | 12501 | -0.084 | -0.1781 | No |
| 43 | Il3ra | 12697 | -0.091 | -0.1822 | No |
| 44 | Irf1 | 13306 | -0.116 | -0.2060 | No |
| 45 | Il1r1 | 13407 | -0.120 | -0.2033 | No |
| 46 | Grb2 | 13566 | -0.127 | -0.2032 | No |
| 47 | Pf4 | 13920 | -0.142 | -0.2121 | No |
| 48 | Crlf2 | 14148 | -0.153 | -0.2138 | No |
| 49 | Il2rg | 14152 | -0.153 | -0.2040 | No |
| 50 | Tgfb1 | 14198 | -0.155 | -0.1962 | No |
| 51 | Il10rb | 14475 | -0.169 | -0.1994 | No |
| 52 | Stat2 | 15178 | -0.205 | -0.2221 | No |
| 53 | Osmr | 15519 | -0.223 | -0.2251 | Yes |
| 54 | Il17ra | 15616 | -0.228 | -0.2152 | Yes |
| 55 | Stat3 | 15845 | -0.241 | -0.2112 | Yes |
| 56 | Pim1 | 15861 | -0.242 | -0.1961 | Yes |
| 57 | Csf2ra | 15899 | -0.245 | -0.1821 | Yes |
| 58 | Itga4 | 16209 | -0.264 | -0.1807 | Yes |
| 59 | Myd88 | 16752 | -0.296 | -0.1893 | Yes |
| 60 | Il13ra1 | 16789 | -0.299 | -0.1717 | Yes |
| 61 | Acvr1b | 17373 | -0.332 | -0.1801 | Yes |
| 62 | Stam2 | 17576 | -0.352 | -0.1675 | Yes |
| 63 | Bak1 | 18021 | -0.395 | -0.1646 | Yes |
| 64 | Il17rb | 18067 | -0.401 | -0.1408 | Yes |
| 65 | Dntt | 18310 | -0.433 | -0.1251 | Yes |
| 66 | Ifngr1 | 18316 | -0.433 | -0.0971 | Yes |
| 67 | Hmox1 | 18451 | -0.455 | -0.0743 | Yes |
| 68 | Irf9 | 19056 | -0.577 | -0.0678 | Yes |
| 69 | Socs3 | 19281 | -0.685 | -0.0347 | Yes |
| 70 | Ifngr2 | 19334 | -0.715 | 0.0092 | Yes |