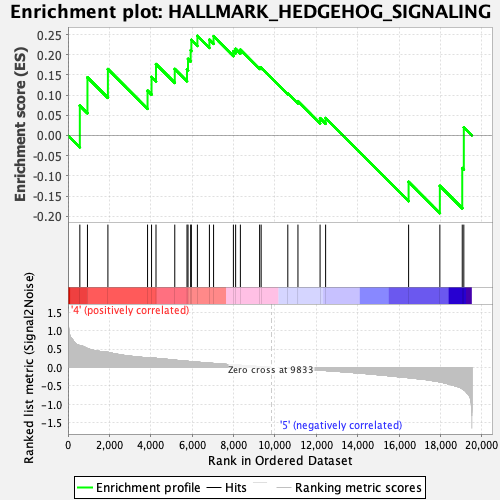
Profile of the Running ES Score & Positions of GeneSet Members on the Rank Ordered List
| Dataset | MPP.MPP_Pheno.cls#Group6_versus_Group8.MPP_Pheno.cls#Group6_versus_Group8_repos |
| Phenotype | MPP_Pheno.cls#Group6_versus_Group8_repos |
| Upregulated in class | 4 |
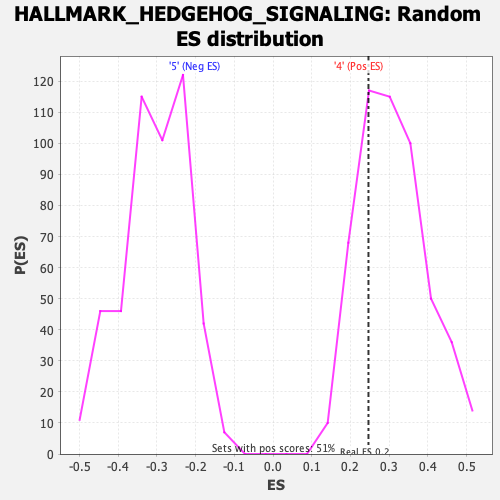
| GeneSet | HALLMARK_HEDGEHOG_SIGNALING |
| Enrichment Score (ES) | 0.24658558 |
| Normalized Enrichment Score (NES) | 0.7929261 |
| Nominal p-value | 0.7411765 |
| FDR q-value | 0.90079665 |
| FWER p-Value | 1.0 |
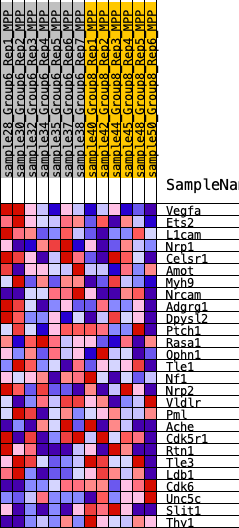
| SYMBOL | RANK IN GENE LIST | RANK METRIC SCORE | RUNNING ES | CORE ENRICHMENT | |
|---|---|---|---|---|---|
| 1 | Vegfa | 572 | 0.594 | 0.0739 | Yes |
| 2 | Ets2 | 940 | 0.512 | 0.1439 | Yes |
| 3 | L1cam | 1928 | 0.409 | 0.1643 | Yes |
| 4 | Nrp1 | 3844 | 0.258 | 0.1109 | Yes |
| 5 | Celsr1 | 4037 | 0.252 | 0.1448 | Yes |
| 6 | Amot | 4252 | 0.247 | 0.1767 | Yes |
| 7 | Myh9 | 5159 | 0.198 | 0.1646 | Yes |
| 8 | Nrcam | 5750 | 0.168 | 0.1635 | Yes |
| 9 | Adgrg1 | 5799 | 0.165 | 0.1896 | Yes |
| 10 | Dpysl2 | 5927 | 0.160 | 0.2108 | Yes |
| 11 | Ptch1 | 5960 | 0.158 | 0.2366 | Yes |
| 12 | Rasa1 | 6252 | 0.143 | 0.2466 | Yes |
| 13 | Ophn1 | 6833 | 0.117 | 0.2371 | No |
| 14 | Tle1 | 7034 | 0.108 | 0.2457 | No |
| 15 | Nf1 | 7992 | 0.069 | 0.2086 | No |
| 16 | Nrp2 | 8100 | 0.065 | 0.2144 | No |
| 17 | Vldlr | 8329 | 0.056 | 0.2125 | No |
| 18 | Pml | 9259 | 0.021 | 0.1685 | No |
| 19 | Ache | 9333 | 0.019 | 0.1680 | No |
| 20 | Cdk5r1 | 10621 | -0.014 | 0.1043 | No |
| 21 | Rtn1 | 11111 | -0.032 | 0.0848 | No |
| 22 | Tle3 | 12180 | -0.073 | 0.0427 | No |
| 23 | Ldb1 | 12448 | -0.081 | 0.0431 | No |
| 24 | Cdk6 | 16458 | -0.275 | -0.1148 | No |
| 25 | Unc5c | 17968 | -0.389 | -0.1247 | No |
| 26 | Slit1 | 19050 | -0.573 | -0.0807 | No |
| 27 | Thy1 | 19126 | -0.601 | 0.0198 | No |