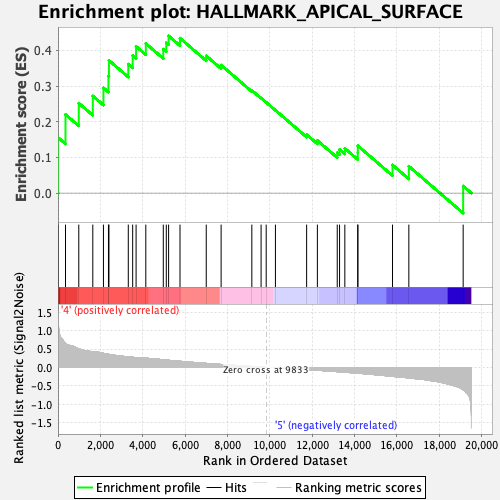
Profile of the Running ES Score & Positions of GeneSet Members on the Rank Ordered List
| Dataset | MPP.MPP_Pheno.cls#Group6_versus_Group8.MPP_Pheno.cls#Group6_versus_Group8_repos |
| Phenotype | MPP_Pheno.cls#Group6_versus_Group8_repos |
| Upregulated in class | 4 |
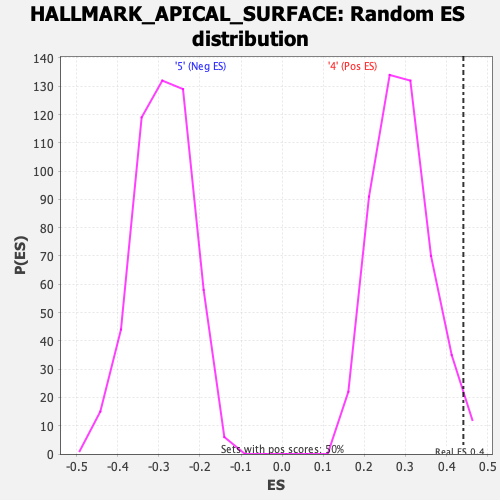
| GeneSet | HALLMARK_APICAL_SURFACE |
| Enrichment Score (ES) | 0.44082636 |
| Normalized Enrichment Score (NES) | 1.5014752 |
| Nominal p-value | 0.016129032 |
| FDR q-value | 0.2734434 |
| FWER p-Value | 0.392 |
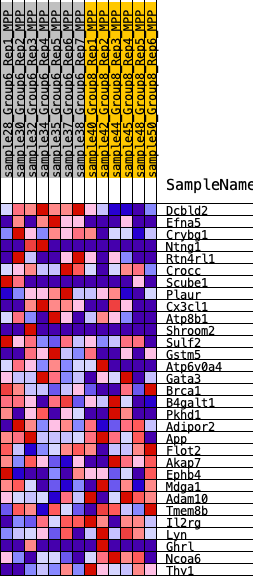
| SYMBOL | RANK IN GENE LIST | RANK METRIC SCORE | RUNNING ES | CORE ENRICHMENT | |
|---|---|---|---|---|---|
| 1 | Dcbld2 | 8 | 1.233 | 0.1556 | Yes |
| 2 | Efna5 | 354 | 0.653 | 0.2205 | Yes |
| 3 | Crybg1 | 981 | 0.503 | 0.2521 | Yes |
| 4 | Ntng1 | 1643 | 0.429 | 0.2724 | Yes |
| 5 | Rtn4rl1 | 2145 | 0.383 | 0.2951 | Yes |
| 6 | Crocc | 2382 | 0.358 | 0.3283 | Yes |
| 7 | Scube1 | 2405 | 0.355 | 0.3721 | Yes |
| 8 | Plaur | 3318 | 0.288 | 0.3616 | Yes |
| 9 | Cx3cl1 | 3525 | 0.276 | 0.3860 | Yes |
| 10 | Atp8b1 | 3686 | 0.265 | 0.4113 | Yes |
| 11 | Shroom2 | 4145 | 0.251 | 0.4195 | Yes |
| 12 | Sulf2 | 4970 | 0.209 | 0.4036 | Yes |
| 13 | Gstm5 | 5112 | 0.200 | 0.4218 | Yes |
| 14 | Atp6v0a4 | 5221 | 0.195 | 0.4408 | Yes |
| 15 | Gata3 | 5759 | 0.167 | 0.4344 | No |
| 16 | Brca1 | 6998 | 0.110 | 0.3848 | No |
| 17 | B4galt1 | 7700 | 0.081 | 0.3590 | No |
| 18 | Pkhd1 | 9150 | 0.026 | 0.2879 | No |
| 19 | Adipor2 | 9587 | 0.009 | 0.2667 | No |
| 20 | App | 9828 | 0.000 | 0.2544 | No |
| 21 | Flot2 | 10264 | -0.003 | 0.2325 | No |
| 22 | Akap7 | 11737 | -0.055 | 0.1639 | No |
| 23 | Ephb4 | 12244 | -0.075 | 0.1474 | No |
| 24 | Mdga1 | 13182 | -0.111 | 0.1133 | No |
| 25 | Adam10 | 13291 | -0.115 | 0.1223 | No |
| 26 | Tmem8b | 13540 | -0.126 | 0.1255 | No |
| 27 | Il2rg | 14152 | -0.153 | 0.1135 | No |
| 28 | Lyn | 14155 | -0.153 | 0.1327 | No |
| 29 | Ghrl | 15791 | -0.238 | 0.0790 | No |
| 30 | Ncoa6 | 16562 | -0.284 | 0.0753 | No |
| 31 | Thy1 | 19126 | -0.601 | 0.0198 | No |