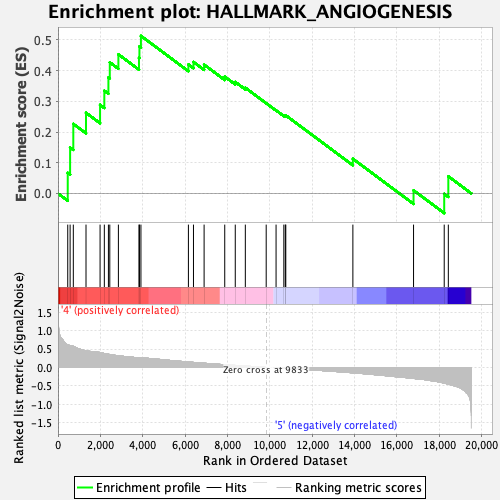
Profile of the Running ES Score & Positions of GeneSet Members on the Rank Ordered List
| Dataset | MPP.MPP_Pheno.cls#Group6_versus_Group8.MPP_Pheno.cls#Group6_versus_Group8_repos |
| Phenotype | MPP_Pheno.cls#Group6_versus_Group8_repos |
| Upregulated in class | 4 |
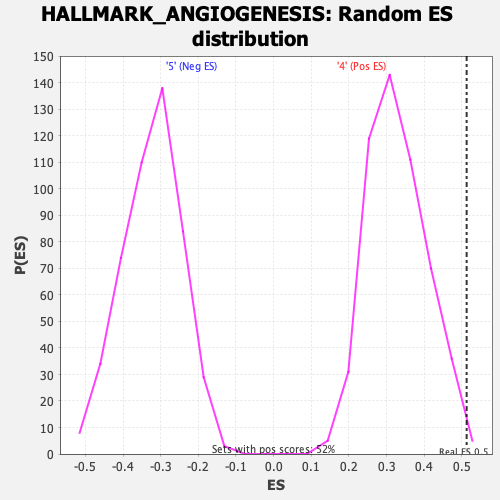
| GeneSet | HALLMARK_ANGIOGENESIS |
| Enrichment Score (ES) | 0.5129297 |
| Normalized Enrichment Score (NES) | 1.5595391 |
| Nominal p-value | 0.005769231 |
| FDR q-value | 0.36167523 |
| FWER p-Value | 0.274 |
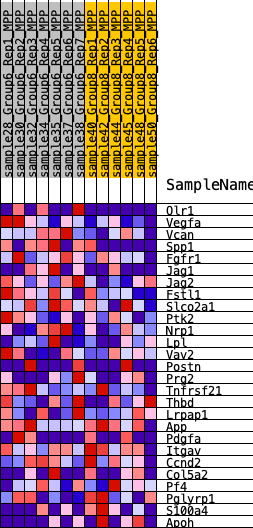
| SYMBOL | RANK IN GENE LIST | RANK METRIC SCORE | RUNNING ES | CORE ENRICHMENT | |
|---|---|---|---|---|---|
| 1 | Olr1 | 460 | 0.611 | 0.0670 | Yes |
| 2 | Vegfa | 572 | 0.594 | 0.1495 | Yes |
| 3 | Vcan | 723 | 0.570 | 0.2264 | Yes |
| 4 | Spp1 | 1322 | 0.451 | 0.2627 | Yes |
| 5 | Fgfr1 | 1986 | 0.403 | 0.2885 | Yes |
| 6 | Jag1 | 2187 | 0.379 | 0.3345 | Yes |
| 7 | Jag2 | 2380 | 0.358 | 0.3778 | Yes |
| 8 | Fstl1 | 2445 | 0.352 | 0.4267 | Yes |
| 9 | Slco2a1 | 2851 | 0.316 | 0.4528 | Yes |
| 10 | Ptk2 | 3823 | 0.260 | 0.4415 | Yes |
| 11 | Nrp1 | 3844 | 0.258 | 0.4788 | Yes |
| 12 | Lpl | 3915 | 0.254 | 0.5129 | Yes |
| 13 | Vav2 | 6156 | 0.148 | 0.4199 | No |
| 14 | Postn | 6395 | 0.136 | 0.4280 | No |
| 15 | Prg2 | 6897 | 0.114 | 0.4192 | No |
| 16 | Tnfrsf21 | 7871 | 0.074 | 0.3802 | No |
| 17 | Thbd | 8368 | 0.055 | 0.3629 | No |
| 18 | Lrpap1 | 8843 | 0.037 | 0.3441 | No |
| 19 | App | 9828 | 0.000 | 0.2936 | No |
| 20 | Pdgfa | 10294 | -0.005 | 0.2704 | No |
| 21 | Itgav | 10661 | -0.014 | 0.2537 | No |
| 22 | Ccnd2 | 10731 | -0.017 | 0.2527 | No |
| 23 | Col5a2 | 10753 | -0.018 | 0.2543 | No |
| 24 | Pf4 | 13920 | -0.142 | 0.1129 | No |
| 25 | Pglyrp1 | 16784 | -0.299 | 0.0103 | No |
| 26 | S100a4 | 18232 | -0.422 | -0.0013 | No |
| 27 | Apoh | 18426 | -0.451 | 0.0557 | No |