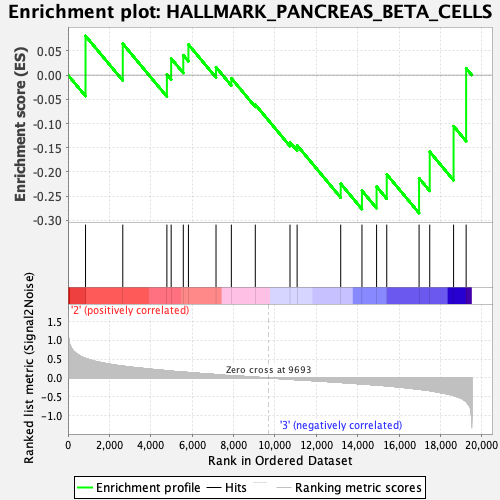
Profile of the Running ES Score & Positions of GeneSet Members on the Rank Ordered List
| Dataset | MPP.MPP_Pheno.cls#Group3_versus_Group4.MPP_Pheno.cls#Group3_versus_Group4_repos |
| Phenotype | MPP_Pheno.cls#Group3_versus_Group4_repos |
| Upregulated in class | 3 |
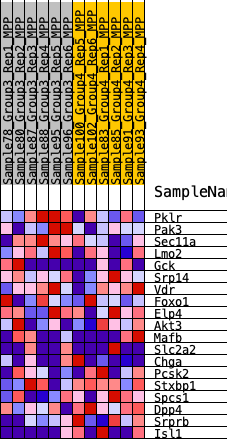
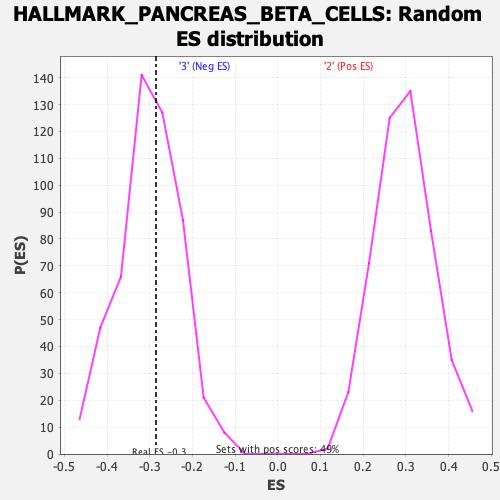
| GeneSet | HALLMARK_PANCREAS_BETA_CELLS |
| Enrichment Score (ES) | -0.285177 |
| Normalized Enrichment Score (NES) | -0.9516214 |
| Nominal p-value | 0.5529412 |
| FDR q-value | 1.0 |
| FWER p-Value | 1.0 |
| SYMBOL | RANK IN GENE LIST | RANK METRIC SCORE | RUNNING ES | CORE ENRICHMENT | |
|---|---|---|---|---|---|
| 1 | Pklr | 847 | 0.512 | 0.0810 | No |
| 2 | Pak3 | 2647 | 0.313 | 0.0648 | No |
| 3 | Sec11a | 4778 | 0.188 | 0.0014 | No |
| 4 | Lmo2 | 4985 | 0.178 | 0.0342 | No |
| 5 | Gck | 5571 | 0.152 | 0.0411 | No |
| 6 | Srp14 | 5819 | 0.143 | 0.0632 | No |
| 7 | Vdr | 7152 | 0.088 | 0.0163 | No |
| 8 | Foxo1 | 7893 | 0.062 | -0.0065 | No |
| 9 | Elp4 | 9050 | 0.020 | -0.0609 | No |
| 10 | Akt3 | 10727 | -0.033 | -0.1388 | No |
| 11 | Mafb | 11071 | -0.046 | -0.1451 | No |
| 12 | Slc2a2 | 13177 | -0.118 | -0.2243 | No |
| 13 | Chga | 14204 | -0.156 | -0.2389 | Yes |
| 14 | Pcsk2 | 14911 | -0.184 | -0.2303 | Yes |
| 15 | Stxbp1 | 15402 | -0.207 | -0.2051 | Yes |
| 16 | Spcs1 | 16964 | -0.297 | -0.2130 | Yes |
| 17 | Dpp4 | 17479 | -0.333 | -0.1583 | Yes |
| 18 | Srprb | 18632 | -0.460 | -0.1055 | Yes |
| 19 | Isl1 | 19238 | -0.619 | 0.0141 | Yes |