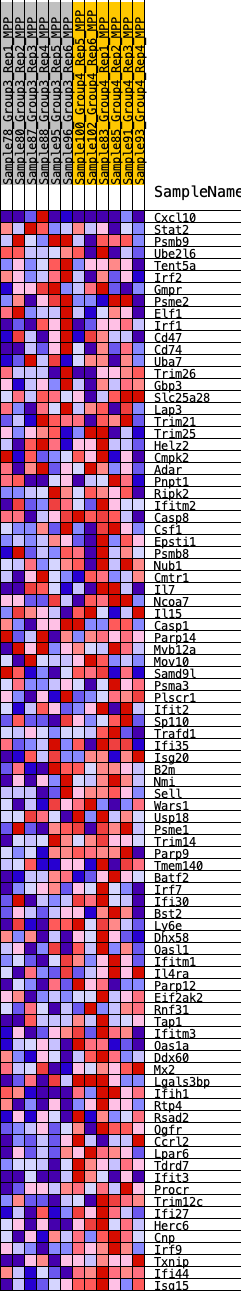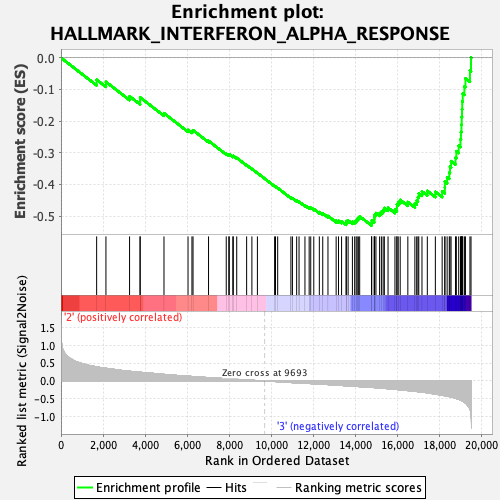
Profile of the Running ES Score & Positions of GeneSet Members on the Rank Ordered List
| Dataset | MPP.MPP_Pheno.cls#Group3_versus_Group4.MPP_Pheno.cls#Group3_versus_Group4_repos |
| Phenotype | MPP_Pheno.cls#Group3_versus_Group4_repos |
| Upregulated in class | 3 |
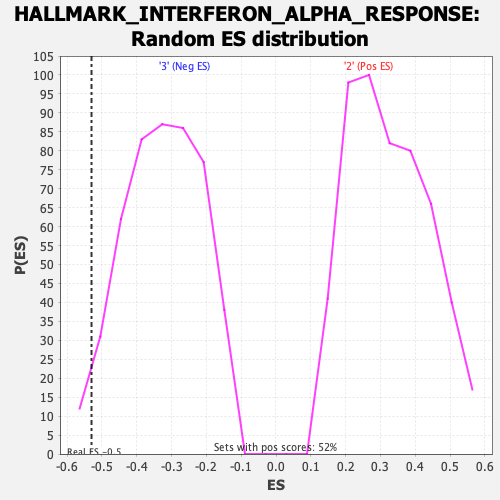
| GeneSet | HALLMARK_INTERFERON_ALPHA_RESPONSE |
| Enrichment Score (ES) | -0.53001654 |
| Normalized Enrichment Score (NES) | -1.619489 |
| Nominal p-value | 0.027310925 |
| FDR q-value | 0.29902142 |
| FWER p-Value | 0.255 |
| SYMBOL | RANK IN GENE LIST | RANK METRIC SCORE | RUNNING ES | CORE ENRICHMENT | |
|---|---|---|---|---|---|
| 1 | Cxcl10 | 1694 | 0.393 | -0.0693 | No |
| 2 | Stat2 | 2136 | 0.352 | -0.0760 | No |
| 3 | Psmb9 | 3259 | 0.270 | -0.1215 | No |
| 4 | Ube2l6 | 3759 | 0.243 | -0.1361 | No |
| 5 | Tent5a | 3762 | 0.243 | -0.1252 | No |
| 6 | Irf2 | 4895 | 0.183 | -0.1751 | No |
| 7 | Gmpr | 6038 | 0.134 | -0.2279 | No |
| 8 | Psme2 | 6224 | 0.124 | -0.2317 | No |
| 9 | Elf1 | 6276 | 0.122 | -0.2288 | No |
| 10 | Irf1 | 7013 | 0.093 | -0.2624 | No |
| 11 | Cd47 | 7855 | 0.064 | -0.3028 | No |
| 12 | Cd74 | 7977 | 0.059 | -0.3064 | No |
| 13 | Uba7 | 7999 | 0.058 | -0.3048 | No |
| 14 | Trim26 | 8168 | 0.052 | -0.3111 | No |
| 15 | Gbp3 | 8190 | 0.052 | -0.3098 | No |
| 16 | Slc25a28 | 8353 | 0.045 | -0.3161 | No |
| 17 | Lap3 | 8824 | 0.028 | -0.3390 | No |
| 18 | Trim21 | 9074 | 0.019 | -0.3509 | No |
| 19 | Trim25 | 9336 | 0.010 | -0.3639 | No |
| 20 | Helz2 | 10154 | -0.013 | -0.4054 | No |
| 21 | Cmpk2 | 10196 | -0.015 | -0.4068 | No |
| 22 | Adar | 10300 | -0.018 | -0.4113 | No |
| 23 | Pnpt1 | 10928 | -0.041 | -0.4416 | No |
| 24 | Ripk2 | 11001 | -0.044 | -0.4433 | No |
| 25 | Ifitm2 | 11202 | -0.051 | -0.4513 | No |
| 26 | Casp8 | 11315 | -0.054 | -0.4546 | No |
| 27 | Csf1 | 11596 | -0.064 | -0.4661 | No |
| 28 | Epsti1 | 11796 | -0.069 | -0.4732 | No |
| 29 | Psmb8 | 11871 | -0.072 | -0.4737 | No |
| 30 | Nub1 | 12016 | -0.077 | -0.4777 | No |
| 31 | Cmtr1 | 12280 | -0.085 | -0.4873 | No |
| 32 | Il7 | 12442 | -0.091 | -0.4914 | No |
| 33 | Ncoa7 | 12690 | -0.099 | -0.4996 | No |
| 34 | Il15 | 13079 | -0.115 | -0.5144 | No |
| 35 | Casp1 | 13191 | -0.119 | -0.5147 | No |
| 36 | Parp14 | 13337 | -0.124 | -0.5165 | No |
| 37 | Mvb12a | 13555 | -0.133 | -0.5216 | No |
| 38 | Mov10 | 13559 | -0.133 | -0.5157 | No |
| 39 | Samd9l | 13648 | -0.136 | -0.5140 | No |
| 40 | Psma3 | 13852 | -0.143 | -0.5180 | No |
| 41 | Plscr1 | 13959 | -0.147 | -0.5167 | No |
| 42 | Ifit2 | 14029 | -0.150 | -0.5134 | No |
| 43 | Sp110 | 14078 | -0.152 | -0.5090 | No |
| 44 | Trafd1 | 14135 | -0.154 | -0.5049 | No |
| 45 | Ifi35 | 14198 | -0.156 | -0.5010 | No |
| 46 | Isg20 | 14763 | -0.180 | -0.5218 | Yes |
| 47 | B2m | 14769 | -0.180 | -0.5139 | Yes |
| 48 | Nmi | 14890 | -0.183 | -0.5117 | Yes |
| 49 | Sell | 14893 | -0.183 | -0.5035 | Yes |
| 50 | Wars1 | 14909 | -0.184 | -0.4959 | Yes |
| 51 | Usp18 | 14971 | -0.186 | -0.4905 | Yes |
| 52 | Psme1 | 15145 | -0.194 | -0.4906 | Yes |
| 53 | Trim14 | 15230 | -0.198 | -0.4859 | Yes |
| 54 | Parp9 | 15312 | -0.203 | -0.4809 | Yes |
| 55 | Tmem140 | 15370 | -0.205 | -0.4745 | Yes |
| 56 | Batf2 | 15546 | -0.214 | -0.4737 | Yes |
| 57 | Irf7 | 15874 | -0.231 | -0.4800 | Yes |
| 58 | Ifi30 | 15967 | -0.237 | -0.4740 | Yes |
| 59 | Bst2 | 15968 | -0.237 | -0.4632 | Yes |
| 60 | Ly6e | 16030 | -0.240 | -0.4554 | Yes |
| 61 | Dhx58 | 16124 | -0.245 | -0.4491 | Yes |
| 62 | Oasl1 | 16487 | -0.267 | -0.4555 | Yes |
| 63 | Ifitm1 | 16821 | -0.288 | -0.4596 | Yes |
| 64 | Il4ra | 16907 | -0.293 | -0.4506 | Yes |
| 65 | Parp12 | 16967 | -0.297 | -0.4401 | Yes |
| 66 | Eif2ak2 | 17007 | -0.300 | -0.4284 | Yes |
| 67 | Rnf31 | 17159 | -0.309 | -0.4222 | Yes |
| 68 | Tap1 | 17413 | -0.327 | -0.4203 | Yes |
| 69 | Ifitm3 | 17795 | -0.365 | -0.4233 | Yes |
| 70 | Oas1a | 18118 | -0.397 | -0.4218 | Yes |
| 71 | Ddx60 | 18244 | -0.410 | -0.4096 | Yes |
| 72 | Mx2 | 18248 | -0.411 | -0.3910 | Yes |
| 73 | Lgals3bp | 18355 | -0.424 | -0.3772 | Yes |
| 74 | Ifih1 | 18457 | -0.436 | -0.3626 | Yes |
| 75 | Rtp4 | 18490 | -0.440 | -0.3442 | Yes |
| 76 | Rsad2 | 18542 | -0.447 | -0.3265 | Yes |
| 77 | Ogfr | 18752 | -0.482 | -0.3153 | Yes |
| 78 | Ccrl2 | 18793 | -0.491 | -0.2950 | Yes |
| 79 | Lpar6 | 18905 | -0.512 | -0.2774 | Yes |
| 80 | Tdrd7 | 18990 | -0.527 | -0.2577 | Yes |
| 81 | Ifit3 | 19012 | -0.533 | -0.2345 | Yes |
| 82 | Procr | 19035 | -0.540 | -0.2111 | Yes |
| 83 | Trim12c | 19046 | -0.544 | -0.1868 | Yes |
| 84 | Ifi27 | 19063 | -0.550 | -0.1626 | Yes |
| 85 | Herc6 | 19074 | -0.555 | -0.1379 | Yes |
| 86 | Cnp | 19096 | -0.564 | -0.1133 | Yes |
| 87 | Irf9 | 19176 | -0.593 | -0.0904 | Yes |
| 88 | Txnip | 19225 | -0.613 | -0.0649 | Yes |
| 89 | Ifi44 | 19439 | -0.783 | -0.0403 | Yes |
| 90 | Isg15 | 19490 | -0.966 | 0.0011 | Yes |