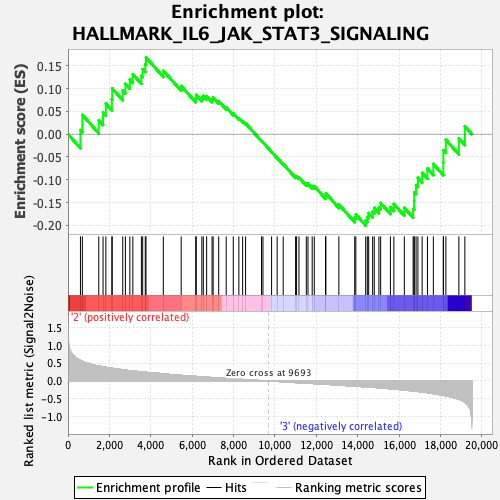
Profile of the Running ES Score & Positions of GeneSet Members on the Rank Ordered List
| Dataset | MPP.MPP_Pheno.cls#Group3_versus_Group4.MPP_Pheno.cls#Group3_versus_Group4_repos |
| Phenotype | MPP_Pheno.cls#Group3_versus_Group4_repos |
| Upregulated in class | 3 |
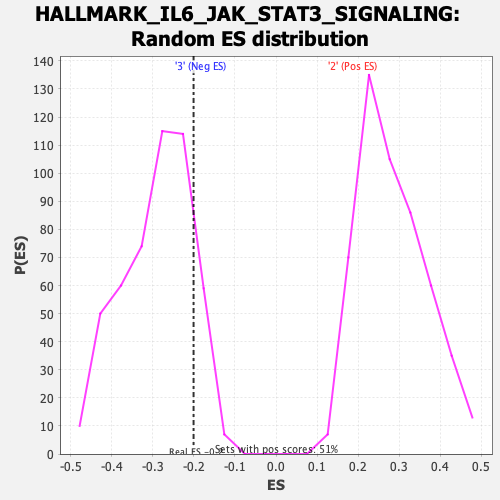
| GeneSet | HALLMARK_IL6_JAK_STAT3_SIGNALING |
| Enrichment Score (ES) | -0.20067269 |
| Normalized Enrichment Score (NES) | -0.6930153 |
| Nominal p-value | 0.86503065 |
| FDR q-value | 0.94974756 |
| FWER p-Value | 1.0 |
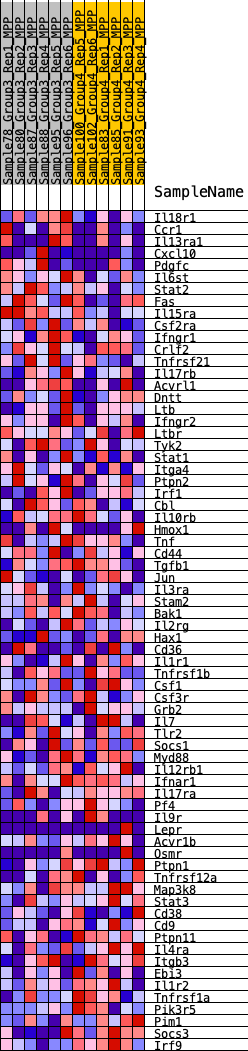
| SYMBOL | RANK IN GENE LIST | RANK METRIC SCORE | RUNNING ES | CORE ENRICHMENT | |
|---|---|---|---|---|---|
| 1 | Il18r1 | 601 | 0.573 | 0.0090 | No |
| 2 | Ccr1 | 694 | 0.545 | 0.0422 | No |
| 3 | Il13ra1 | 1487 | 0.417 | 0.0306 | No |
| 4 | Cxcl10 | 1694 | 0.393 | 0.0473 | No |
| 5 | Pdgfc | 1830 | 0.379 | 0.0668 | No |
| 6 | Il6st | 2119 | 0.354 | 0.0766 | No |
| 7 | Stat2 | 2136 | 0.352 | 0.1004 | No |
| 8 | Fas | 2646 | 0.313 | 0.0960 | No |
| 9 | Il15ra | 2773 | 0.302 | 0.1106 | No |
| 10 | Csf2ra | 2988 | 0.287 | 0.1196 | No |
| 11 | Ifngr1 | 3133 | 0.278 | 0.1316 | No |
| 12 | Crlf2 | 3546 | 0.255 | 0.1282 | No |
| 13 | Tnfrsf21 | 3609 | 0.252 | 0.1425 | No |
| 14 | Il17rb | 3734 | 0.245 | 0.1532 | No |
| 15 | Acvrl1 | 3769 | 0.242 | 0.1683 | No |
| 16 | Dntt | 4606 | 0.199 | 0.1392 | No |
| 17 | Ltb | 5469 | 0.156 | 0.1057 | No |
| 18 | Ifngr2 | 6171 | 0.127 | 0.0785 | No |
| 19 | Ltbr | 6197 | 0.126 | 0.0860 | No |
| 20 | Tyk2 | 6467 | 0.115 | 0.0801 | No |
| 21 | Stat1 | 6538 | 0.112 | 0.0843 | No |
| 22 | Itga4 | 6699 | 0.106 | 0.0834 | No |
| 23 | Ptpn2 | 6961 | 0.095 | 0.0766 | No |
| 24 | Irf1 | 7013 | 0.093 | 0.0805 | No |
| 25 | Cbl | 7282 | 0.083 | 0.0726 | No |
| 26 | Il10rb | 7644 | 0.072 | 0.0590 | No |
| 27 | Hmox1 | 7986 | 0.059 | 0.0455 | No |
| 28 | Tnf | 8256 | 0.049 | 0.0351 | No |
| 29 | Cd44 | 8439 | 0.042 | 0.0287 | No |
| 30 | Tgfb1 | 8581 | 0.037 | 0.0240 | No |
| 31 | Jun | 9351 | 0.010 | -0.0149 | No |
| 32 | Il3ra | 9420 | 0.008 | -0.0178 | No |
| 33 | Stam2 | 9837 | -0.002 | -0.0391 | No |
| 34 | Bak1 | 10106 | -0.012 | -0.0520 | No |
| 35 | Il2rg | 10398 | -0.022 | -0.0655 | No |
| 36 | Hax1 | 10997 | -0.044 | -0.0931 | No |
| 37 | Cd36 | 11045 | -0.045 | -0.0924 | No |
| 38 | Il1r1 | 11160 | -0.049 | -0.0948 | No |
| 39 | Tnfrsf1b | 11515 | -0.061 | -0.1088 | No |
| 40 | Csf1 | 11596 | -0.064 | -0.1084 | No |
| 41 | Csf3r | 11799 | -0.069 | -0.1140 | No |
| 42 | Grb2 | 11900 | -0.073 | -0.1141 | No |
| 43 | Il7 | 12442 | -0.091 | -0.1355 | No |
| 44 | Tlr2 | 12461 | -0.092 | -0.1300 | No |
| 45 | Socs1 | 13088 | -0.115 | -0.1542 | No |
| 46 | Myd88 | 13853 | -0.143 | -0.1835 | No |
| 47 | Il12rb1 | 13908 | -0.145 | -0.1762 | No |
| 48 | Ifnar1 | 14385 | -0.164 | -0.1893 | Yes |
| 49 | Il17ra | 14463 | -0.168 | -0.1815 | Yes |
| 50 | Pf4 | 14528 | -0.170 | -0.1730 | Yes |
| 51 | Il9r | 14720 | -0.178 | -0.1704 | Yes |
| 52 | Lepr | 14799 | -0.180 | -0.1618 | Yes |
| 53 | Acvr1b | 15024 | -0.189 | -0.1602 | Yes |
| 54 | Osmr | 15108 | -0.192 | -0.1511 | Yes |
| 55 | Ptpn1 | 15579 | -0.216 | -0.1602 | Yes |
| 56 | Tnfrsf12a | 15745 | -0.224 | -0.1531 | Yes |
| 57 | Map3k8 | 16251 | -0.252 | -0.1615 | Yes |
| 58 | Stat3 | 16677 | -0.279 | -0.1640 | Yes |
| 59 | Cd38 | 16724 | -0.281 | -0.1467 | Yes |
| 60 | Cd9 | 16730 | -0.282 | -0.1273 | Yes |
| 61 | Ptpn11 | 16818 | -0.288 | -0.1118 | Yes |
| 62 | Il4ra | 16907 | -0.293 | -0.0958 | Yes |
| 63 | Itgb3 | 17113 | -0.307 | -0.0850 | Yes |
| 64 | Ebi3 | 17369 | -0.325 | -0.0755 | Yes |
| 65 | Il1r2 | 17653 | -0.352 | -0.0655 | Yes |
| 66 | Tnfrsf1a | 18136 | -0.398 | -0.0626 | Yes |
| 67 | Pik3r5 | 18139 | -0.398 | -0.0350 | Yes |
| 68 | Pim1 | 18259 | -0.412 | -0.0124 | Yes |
| 69 | Socs3 | 18887 | -0.509 | -0.0092 | Yes |
| 70 | Irf9 | 19176 | -0.593 | 0.0173 | Yes |