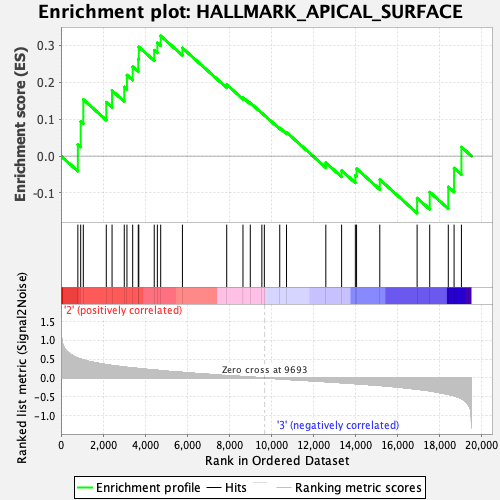
Profile of the Running ES Score & Positions of GeneSet Members on the Rank Ordered List
| Dataset | MPP.MPP_Pheno.cls#Group3_versus_Group4.MPP_Pheno.cls#Group3_versus_Group4_repos |
| Phenotype | MPP_Pheno.cls#Group3_versus_Group4_repos |
| Upregulated in class | 2 |
| GeneSet | HALLMARK_APICAL_SURFACE |
| Enrichment Score (ES) | 0.32599524 |
| Normalized Enrichment Score (NES) | 1.0932178 |
| Nominal p-value | 0.35222673 |
| FDR q-value | 1.0 |
| FWER p-Value | 0.992 |
| SYMBOL | RANK IN GENE LIST | RANK METRIC SCORE | RUNNING ES | CORE ENRICHMENT | |
|---|---|---|---|---|---|
| 1 | Ephb4 | 801 | 0.522 | 0.0314 | Yes |
| 2 | Crybg1 | 936 | 0.499 | 0.0938 | Yes |
| 3 | Gata3 | 1061 | 0.475 | 0.1534 | Yes |
| 4 | Ghrl | 2153 | 0.352 | 0.1462 | Yes |
| 5 | Efna5 | 2427 | 0.327 | 0.1776 | Yes |
| 6 | Atp8b1 | 3008 | 0.286 | 0.1876 | Yes |
| 7 | Ntng1 | 3135 | 0.278 | 0.2198 | Yes |
| 8 | Sulf2 | 3407 | 0.262 | 0.2422 | Yes |
| 9 | Crocc | 3673 | 0.248 | 0.2630 | Yes |
| 10 | Akap7 | 3698 | 0.247 | 0.2960 | Yes |
| 11 | Brca1 | 4432 | 0.208 | 0.2873 | Yes |
| 12 | App | 4580 | 0.201 | 0.3076 | Yes |
| 13 | Tmem8b | 4739 | 0.191 | 0.3260 | Yes |
| 14 | Plaur | 5772 | 0.145 | 0.2932 | No |
| 15 | Adam10 | 7877 | 0.063 | 0.1939 | No |
| 16 | Adipor2 | 8650 | 0.034 | 0.1591 | No |
| 17 | B4galt1 | 8998 | 0.022 | 0.1443 | No |
| 18 | Ncoa6 | 9548 | 0.004 | 0.1168 | No |
| 19 | Thy1 | 9666 | 0.001 | 0.1109 | No |
| 20 | Il2rg | 10398 | -0.022 | 0.0764 | No |
| 21 | Pkhd1 | 10720 | -0.033 | 0.0645 | No |
| 22 | Cx3cl1 | 12588 | -0.096 | -0.0180 | No |
| 23 | Lyn | 13339 | -0.124 | -0.0393 | No |
| 24 | Mdga1 | 13992 | -0.148 | -0.0522 | No |
| 25 | Rtn4rl1 | 14050 | -0.151 | -0.0342 | No |
| 26 | Gstm5 | 15154 | -0.194 | -0.0638 | No |
| 27 | Shroom2 | 16928 | -0.295 | -0.1139 | No |
| 28 | Flot2 | 17527 | -0.338 | -0.0977 | No |
| 29 | Scube1 | 18410 | -0.428 | -0.0835 | No |
| 30 | Dcbld2 | 18685 | -0.469 | -0.0325 | No |
| 31 | Atp6v0a4 | 19034 | -0.540 | 0.0245 | No |

