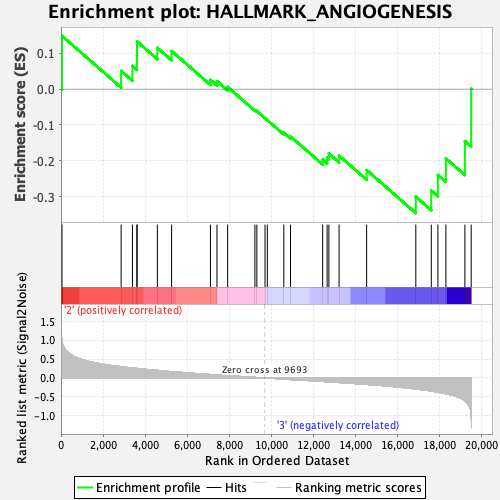
Profile of the Running ES Score & Positions of GeneSet Members on the Rank Ordered List
| Dataset | MPP.MPP_Pheno.cls#Group3_versus_Group4.MPP_Pheno.cls#Group3_versus_Group4_repos |
| Phenotype | MPP_Pheno.cls#Group3_versus_Group4_repos |
| Upregulated in class | 3 |
| GeneSet | HALLMARK_ANGIOGENESIS |
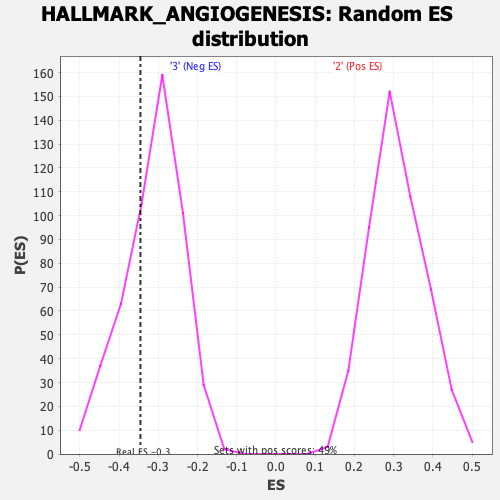
| Enrichment Score (ES) | -0.34574208 |
| Normalized Enrichment Score (NES) | -1.1065519 |
| Nominal p-value | 0.29841897 |
| FDR q-value | 0.9856691 |
| FWER p-Value | 0.985 |
| SYMBOL | RANK IN GENE LIST | RANK METRIC SCORE | RUNNING ES | CORE ENRICHMENT | |
|---|---|---|---|---|---|
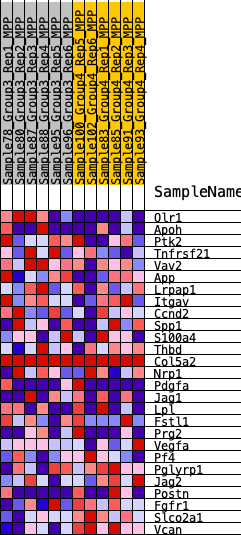
| 1 | Olr1 | 47 | 0.956 | 0.1483 | No |
| 2 | Apoh | 2858 | 0.295 | 0.0507 | No |
| 3 | Ptk2 | 3396 | 0.262 | 0.0645 | No |
| 4 | Tnfrsf21 | 3609 | 0.252 | 0.0934 | No |
| 5 | Vav2 | 3614 | 0.252 | 0.1328 | No |
| 6 | App | 4580 | 0.201 | 0.1149 | No |
| 7 | Lrpap1 | 5258 | 0.164 | 0.1061 | No |
| 8 | Itgav | 7104 | 0.090 | 0.0257 | No |
| 9 | Ccnd2 | 7414 | 0.079 | 0.0222 | No |
| 10 | Spp1 | 7921 | 0.061 | 0.0059 | No |
| 11 | S100a4 | 9218 | 0.014 | -0.0583 | No |
| 12 | Thbd | 9310 | 0.011 | -0.0612 | No |
| 13 | Col5a2 | 9698 | 0.000 | -0.0811 | No |
| 14 | Nrp1 | 9808 | -0.002 | -0.0864 | No |
| 15 | Pdgfa | 10592 | -0.029 | -0.1220 | No |
| 16 | Jag1 | 10909 | -0.041 | -0.1318 | No |
| 17 | Lpl | 12439 | -0.091 | -0.1959 | No |
| 18 | Fstl1 | 12650 | -0.098 | -0.1912 | No |
| 19 | Prg2 | 12734 | -0.101 | -0.1796 | No |
| 20 | Vegfa | 13218 | -0.120 | -0.1855 | No |
| 21 | Pf4 | 14528 | -0.170 | -0.2258 | No |
| 22 | Pglyrp1 | 16866 | -0.291 | -0.2998 | Yes |
| 23 | Jag2 | 17601 | -0.346 | -0.2829 | Yes |
| 24 | Postn | 17916 | -0.377 | -0.2395 | Yes |
| 25 | Fgfr1 | 18296 | -0.416 | -0.1933 | Yes |
| 26 | Slco2a1 | 19199 | -0.600 | -0.1449 | Yes |
| 27 | Vcan | 19498 | -1.021 | 0.0007 | Yes |