Profile of the Running ES Score & Positions of GeneSet Members on the Rank Ordered List
| Dataset | MPP.MPP_Pheno.cls#Group2_versus_Group4.MPP_Pheno.cls#Group2_versus_Group4_repos |
| Phenotype | MPP_Pheno.cls#Group2_versus_Group4_repos |
| Upregulated in class | 1 |
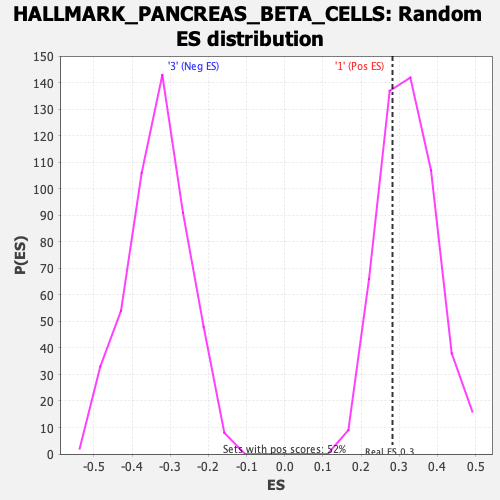
| GeneSet | HALLMARK_PANCREAS_BETA_CELLS |
| Enrichment Score (ES) | 0.28230605 |
| Normalized Enrichment Score (NES) | 0.8762815 |
| Nominal p-value | 0.6815534 |
| FDR q-value | 0.9372648 |
| FWER p-Value | 1.0 |
| SYMBOL | RANK IN GENE LIST | RANK METRIC SCORE | RUNNING ES | CORE ENRICHMENT | |
|---|---|---|---|---|---|
| 1 | Pak3 | 60 | 0.919 | 0.2017 | Yes |
| 2 | Foxo1 | 795 | 0.531 | 0.2823 | Yes |
| 3 | Gck | 3968 | 0.240 | 0.1731 | No |
| 4 | Srp14 | 5993 | 0.139 | 0.1002 | No |
| 5 | Slc2a2 | 7085 | 0.090 | 0.0644 | No |
| 6 | Sec11a | 7210 | 0.085 | 0.0770 | No |
| 7 | Pklr | 8157 | 0.049 | 0.0393 | No |
| 8 | Dpp4 | 9316 | 0.004 | -0.0192 | No |
| 9 | Mafb | 10220 | -0.029 | -0.0591 | No |
| 10 | Akt3 | 10523 | -0.042 | -0.0653 | No |
| 11 | Pcsk2 | 11391 | -0.075 | -0.0931 | No |
| 12 | Elp4 | 11573 | -0.082 | -0.0841 | No |
| 13 | Vdr | 13421 | -0.161 | -0.1428 | No |
| 14 | Lmo2 | 13645 | -0.171 | -0.1160 | No |
| 15 | Spcs1 | 15618 | -0.270 | -0.1571 | No |
| 16 | Chga | 16761 | -0.337 | -0.1406 | No |
| 17 | Isl1 | 17387 | -0.384 | -0.0871 | No |
| 18 | Stxbp1 | 17427 | -0.386 | -0.0031 | No |
| 19 | Srprb | 18409 | -0.494 | 0.0566 | No |