Profile of the Running ES Score & Positions of GeneSet Members on the Rank Ordered List
| Dataset | MPP.MPP_Pheno.cls#Group2_versus_Group4.MPP_Pheno.cls#Group2_versus_Group4_repos |
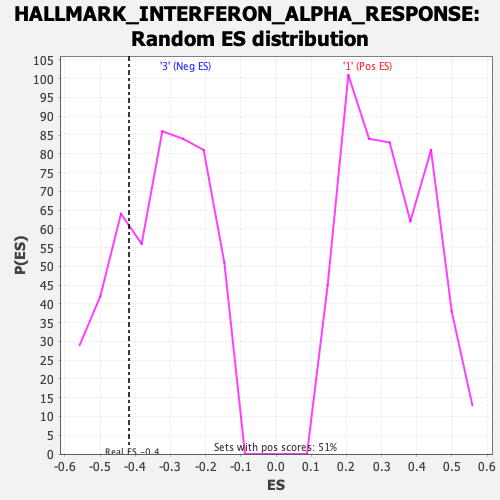
| Phenotype | MPP_Pheno.cls#Group2_versus_Group4_repos |
| Upregulated in class | 3 |
| GeneSet | HALLMARK_INTERFERON_ALPHA_RESPONSE |
| Enrichment Score (ES) | -0.41778806 |
| Normalized Enrichment Score (NES) | -1.2790211 |
| Nominal p-value | 0.24340771 |
| FDR q-value | 1.0 |
| FWER p-Value | 0.813 |
| SYMBOL | RANK IN GENE LIST | RANK METRIC SCORE | RUNNING ES | CORE ENRICHMENT | |
|---|---|---|---|---|---|
| 1 | Parp14 | 1024 | 0.492 | -0.0306 | No |
| 2 | Lap3 | 1100 | 0.482 | -0.0127 | No |
| 3 | Irf1 | 1590 | 0.418 | -0.0191 | No |
| 4 | Il4ra | 1618 | 0.415 | -0.0018 | No |
| 5 | Ube2l6 | 1711 | 0.405 | 0.0117 | No |
| 6 | Gbp3 | 2297 | 0.348 | -0.0027 | No |
| 7 | Trim26 | 2653 | 0.322 | -0.0065 | No |
| 8 | Adar | 2815 | 0.310 | -0.0008 | No |
| 9 | Cxcl10 | 3592 | 0.263 | -0.0289 | No |
| 10 | Ifit2 | 4263 | 0.224 | -0.0534 | No |
| 11 | Ifitm1 | 4614 | 0.208 | -0.0620 | No |
| 12 | Parp9 | 4838 | 0.196 | -0.0647 | No |
| 13 | Stat2 | 5289 | 0.173 | -0.0801 | No |
| 14 | Trim21 | 5915 | 0.143 | -0.1059 | No |
| 15 | Trim25 | 5938 | 0.141 | -0.1006 | No |
| 16 | Cmtr1 | 6124 | 0.133 | -0.1042 | No |
| 17 | Wars1 | 6684 | 0.109 | -0.1280 | No |
| 18 | Nub1 | 7073 | 0.091 | -0.1439 | No |
| 19 | Usp18 | 7137 | 0.088 | -0.1432 | No |
| 20 | Pnpt1 | 7283 | 0.082 | -0.1469 | No |
| 21 | Plscr1 | 7964 | 0.056 | -0.1794 | No |
| 22 | Il7 | 8038 | 0.054 | -0.1808 | No |
| 23 | Tent5a | 8095 | 0.051 | -0.1814 | No |
| 24 | Cd74 | 8661 | 0.028 | -0.2092 | No |
| 25 | Parp12 | 8876 | 0.019 | -0.2194 | No |
| 26 | Samd9l | 8961 | 0.016 | -0.2230 | No |
| 27 | Helz2 | 9104 | 0.012 | -0.2297 | No |
| 28 | Cd47 | 9118 | 0.011 | -0.2299 | No |
| 29 | Cmpk2 | 9240 | 0.007 | -0.2358 | No |
| 30 | Epsti1 | 9549 | -0.002 | -0.2516 | No |
| 31 | Psme2 | 9551 | -0.003 | -0.2515 | No |
| 32 | Elf1 | 9911 | -0.017 | -0.2692 | No |
| 33 | Ifit3 | 9919 | -0.017 | -0.2688 | No |
| 34 | Mx2 | 9930 | -0.018 | -0.2685 | No |
| 35 | Casp8 | 10405 | -0.037 | -0.2913 | No |
| 36 | Ifih1 | 10892 | -0.056 | -0.3138 | No |
| 37 | Bst2 | 11068 | -0.062 | -0.3200 | No |
| 38 | Csf1 | 11155 | -0.066 | -0.3214 | No |
| 39 | Eif2ak2 | 11253 | -0.070 | -0.3233 | No |
| 40 | Slc25a28 | 12485 | -0.121 | -0.3812 | No |
| 41 | Tdrd7 | 12657 | -0.127 | -0.3843 | No |
| 42 | Ifi35 | 12731 | -0.130 | -0.3822 | No |
| 43 | Ncoa7 | 12788 | -0.132 | -0.3791 | No |
| 44 | Dhx58 | 13222 | -0.151 | -0.3946 | No |
| 45 | Irf2 | 13301 | -0.155 | -0.3917 | No |
| 46 | Txnip | 13381 | -0.159 | -0.3885 | No |
| 47 | Ddx60 | 13602 | -0.169 | -0.3923 | No |
| 48 | Ifitm2 | 13759 | -0.176 | -0.3924 | No |
| 49 | Trim12c | 13891 | -0.181 | -0.3909 | No |
| 50 | Trafd1 | 13951 | -0.185 | -0.3857 | No |
| 51 | Psmb9 | 13957 | -0.185 | -0.3776 | No |
| 52 | Rnf31 | 13983 | -0.186 | -0.3705 | No |
| 53 | Ripk2 | 14426 | -0.207 | -0.3839 | No |
| 54 | Sp110 | 14459 | -0.209 | -0.3762 | No |
| 55 | Herc6 | 14574 | -0.215 | -0.3724 | No |
| 56 | Ifitm3 | 14799 | -0.225 | -0.3738 | No |
| 57 | Psme1 | 15654 | -0.272 | -0.4056 | Yes |
| 58 | Ifi30 | 15734 | -0.277 | -0.3972 | Yes |
| 59 | Rtp4 | 15761 | -0.279 | -0.3860 | Yes |
| 60 | Casp1 | 15854 | -0.285 | -0.3779 | Yes |
| 61 | Irf9 | 15890 | -0.286 | -0.3668 | Yes |
| 62 | Cnp | 15906 | -0.287 | -0.3547 | Yes |
| 63 | Rsad2 | 15982 | -0.292 | -0.3454 | Yes |
| 64 | Irf7 | 16223 | -0.303 | -0.3441 | Yes |
| 65 | Psma3 | 16367 | -0.313 | -0.3374 | Yes |
| 66 | Gmpr | 16406 | -0.315 | -0.3252 | Yes |
| 67 | Sell | 16416 | -0.316 | -0.3114 | Yes |
| 68 | Oas1a | 16437 | -0.317 | -0.2982 | Yes |
| 69 | Psmb8 | 16664 | -0.330 | -0.2949 | Yes |
| 70 | Il15 | 16988 | -0.354 | -0.2956 | Yes |
| 71 | Uba7 | 16998 | -0.354 | -0.2802 | Yes |
| 72 | Isg15 | 17295 | -0.376 | -0.2785 | Yes |
| 73 | Tmem140 | 17347 | -0.380 | -0.2640 | Yes |
| 74 | Oasl1 | 17443 | -0.388 | -0.2514 | Yes |
| 75 | Mov10 | 17513 | -0.394 | -0.2372 | Yes |
| 76 | Tap1 | 17537 | -0.397 | -0.2205 | Yes |
| 77 | Ogfr | 17538 | -0.397 | -0.2027 | Yes |
| 78 | Ly6e | 17573 | -0.400 | -0.1864 | Yes |
| 79 | Trim14 | 17973 | -0.439 | -0.1872 | Yes |
| 80 | Lpar6 | 18136 | -0.456 | -0.1750 | Yes |
| 81 | Batf2 | 18180 | -0.463 | -0.1564 | Yes |
| 82 | Mvb12a | 18208 | -0.465 | -0.1368 | Yes |
| 83 | B2m | 18217 | -0.466 | -0.1163 | Yes |
| 84 | Ifi44 | 18360 | -0.485 | -0.1017 | Yes |
| 85 | Nmi | 18365 | -0.486 | -0.0801 | Yes |
| 86 | Ifi27 | 18404 | -0.492 | -0.0599 | Yes |
| 87 | Ccrl2 | 18641 | -0.530 | -0.0481 | Yes |
| 88 | Lgals3bp | 18995 | -0.609 | -0.0389 | Yes |
| 89 | Procr | 19031 | -0.622 | -0.0127 | Yes |
| 90 | Isg20 | 19389 | -0.831 | 0.0063 | Yes |