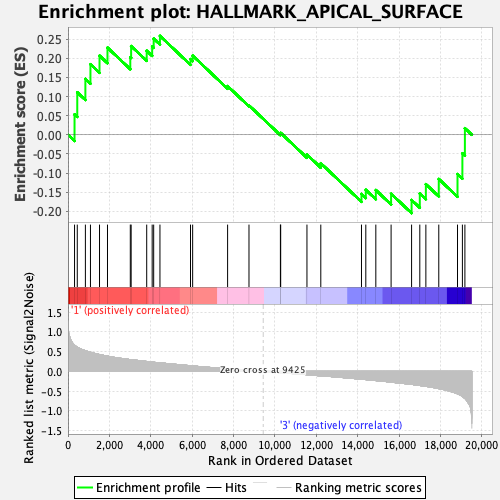
Profile of the Running ES Score & Positions of GeneSet Members on the Rank Ordered List
| Dataset | MPP.MPP_Pheno.cls#Group2_versus_Group4.MPP_Pheno.cls#Group2_versus_Group4_repos |
| Phenotype | MPP_Pheno.cls#Group2_versus_Group4_repos |
| Upregulated in class | 1 |
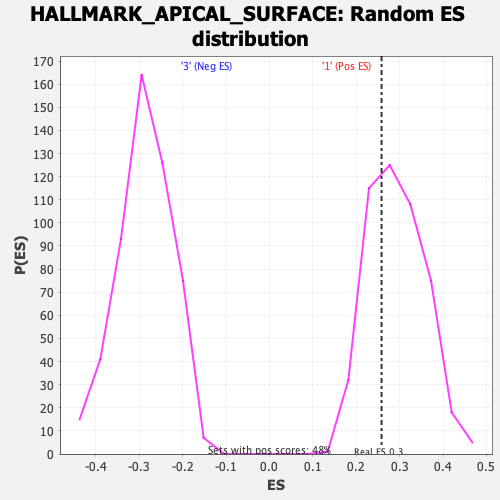
| GeneSet | HALLMARK_APICAL_SURFACE |
| Enrichment Score (ES) | 0.25838527 |
| Normalized Enrichment Score (NES) | 0.8880737 |
| Nominal p-value | 0.65762 |
| FDR q-value | 1.0 |
| FWER p-Value | 1.0 |
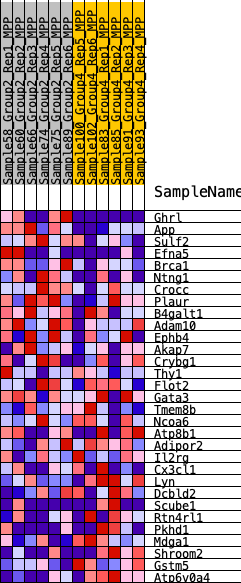
| SYMBOL | RANK IN GENE LIST | RANK METRIC SCORE | RUNNING ES | CORE ENRICHMENT | |
|---|---|---|---|---|---|
| 1 | Ghrl | 316 | 0.662 | 0.0533 | Yes |
| 2 | App | 448 | 0.612 | 0.1109 | Yes |
| 3 | Sulf2 | 840 | 0.524 | 0.1459 | Yes |
| 4 | Efna5 | 1085 | 0.484 | 0.1843 | Yes |
| 5 | Brca1 | 1523 | 0.427 | 0.2067 | Yes |
| 6 | Ntng1 | 1908 | 0.388 | 0.2277 | Yes |
| 7 | Crocc | 3010 | 0.299 | 0.2026 | Yes |
| 8 | Plaur | 3051 | 0.297 | 0.2317 | Yes |
| 9 | B4galt1 | 3803 | 0.251 | 0.2195 | Yes |
| 10 | Adam10 | 4067 | 0.235 | 0.2307 | Yes |
| 11 | Ephb4 | 4140 | 0.231 | 0.2512 | Yes |
| 12 | Akap7 | 4443 | 0.216 | 0.2584 | Yes |
| 13 | Crybg1 | 5919 | 0.142 | 0.1976 | No |
| 14 | Thy1 | 6023 | 0.137 | 0.2068 | No |
| 15 | Flot2 | 7712 | 0.067 | 0.1272 | No |
| 16 | Gata3 | 8745 | 0.025 | 0.0768 | No |
| 17 | Tmem8b | 10263 | -0.031 | 0.0022 | No |
| 18 | Ncoa6 | 10277 | -0.032 | 0.0049 | No |
| 19 | Atp8b1 | 11546 | -0.081 | -0.0517 | No |
| 20 | Adipor2 | 12215 | -0.111 | -0.0744 | No |
| 21 | Il2rg | 14181 | -0.195 | -0.1547 | No |
| 22 | Cx3cl1 | 14390 | -0.205 | -0.1438 | No |
| 23 | Lyn | 14874 | -0.230 | -0.1445 | No |
| 24 | Dcbld2 | 15612 | -0.269 | -0.1540 | No |
| 25 | Scube1 | 16602 | -0.327 | -0.1705 | No |
| 26 | Rtn4rl1 | 16999 | -0.354 | -0.1536 | No |
| 27 | Pkhd1 | 17292 | -0.375 | -0.1291 | No |
| 28 | Mdga1 | 17916 | -0.433 | -0.1156 | No |
| 29 | Shroom2 | 18821 | -0.564 | -0.1027 | No |
| 30 | Gstm5 | 19057 | -0.632 | -0.0484 | No |
| 31 | Atp6v0a4 | 19178 | -0.682 | 0.0171 | No |