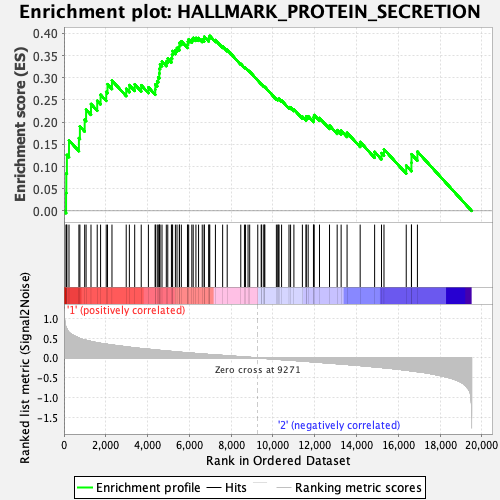
Profile of the Running ES Score & Positions of GeneSet Members on the Rank Ordered List
| Dataset | MPP.MPP_Pheno.cls#Group2_versus_Group3.MPP_Pheno.cls#Group2_versus_Group3_repos |
| Phenotype | MPP_Pheno.cls#Group2_versus_Group3_repos |
| Upregulated in class | 1 |
| GeneSet | HALLMARK_PROTEIN_SECRETION |
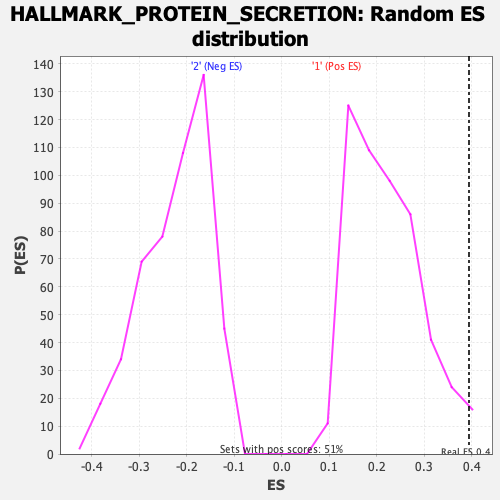
| Enrichment Score (ES) | 0.3945682 |
| Normalized Enrichment Score (NES) | 1.7875534 |
| Nominal p-value | 0.025490196 |
| FDR q-value | 0.08360374 |
| FWER p-Value | 0.064 |
| SYMBOL | RANK IN GENE LIST | RANK METRIC SCORE | RUNNING ES | CORE ENRICHMENT | |
|---|---|---|---|---|---|
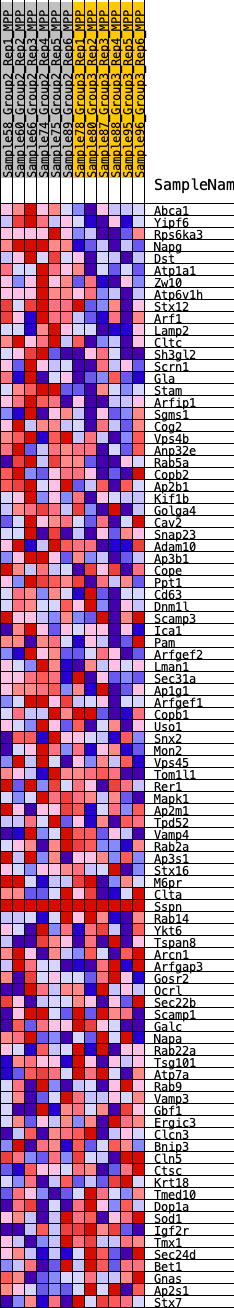
| 1 | Abca1 | 100 | 0.769 | 0.0403 | Yes |
| 2 | Yipf6 | 111 | 0.755 | 0.0844 | Yes |
| 3 | Rps6ka3 | 138 | 0.728 | 0.1262 | Yes |
| 4 | Napg | 239 | 0.642 | 0.1590 | Yes |
| 5 | Dst | 714 | 0.499 | 0.1641 | Yes |
| 6 | Atp1a1 | 761 | 0.488 | 0.1906 | Yes |
| 7 | Zw10 | 990 | 0.452 | 0.2056 | Yes |
| 8 | Atp6v1h | 1057 | 0.444 | 0.2285 | Yes |
| 9 | Stx12 | 1292 | 0.415 | 0.2410 | Yes |
| 10 | Arf1 | 1590 | 0.382 | 0.2483 | Yes |
| 11 | Lamp2 | 1751 | 0.367 | 0.2618 | Yes |
| 12 | Cltc | 2021 | 0.346 | 0.2685 | Yes |
| 13 | Sh3gl2 | 2083 | 0.342 | 0.2856 | Yes |
| 14 | Scrn1 | 2296 | 0.325 | 0.2939 | Yes |
| 15 | Gla | 2978 | 0.279 | 0.2753 | Yes |
| 16 | Stam | 3129 | 0.270 | 0.2836 | Yes |
| 17 | Arfip1 | 3384 | 0.252 | 0.2854 | Yes |
| 18 | Sgms1 | 3697 | 0.235 | 0.2832 | Yes |
| 19 | Cog2 | 4040 | 0.218 | 0.2785 | Yes |
| 20 | Vps4b | 4367 | 0.201 | 0.2736 | Yes |
| 21 | Anp32e | 4372 | 0.201 | 0.2853 | Yes |
| 22 | Rab5a | 4461 | 0.197 | 0.2924 | Yes |
| 23 | Copb2 | 4511 | 0.194 | 0.3013 | Yes |
| 24 | Ap2b1 | 4562 | 0.191 | 0.3101 | Yes |
| 25 | Kif1b | 4573 | 0.191 | 0.3208 | Yes |
| 26 | Golga4 | 4598 | 0.190 | 0.3308 | Yes |
| 27 | Cav2 | 4691 | 0.185 | 0.3370 | Yes |
| 28 | Snap23 | 4897 | 0.174 | 0.3368 | Yes |
| 29 | Adam10 | 4967 | 0.172 | 0.3434 | Yes |
| 30 | Ap3b1 | 5142 | 0.164 | 0.3441 | Yes |
| 31 | Cope | 5173 | 0.162 | 0.3521 | Yes |
| 32 | Ppt1 | 5199 | 0.161 | 0.3603 | Yes |
| 33 | Cd63 | 5332 | 0.153 | 0.3626 | Yes |
| 34 | Dnm1l | 5410 | 0.150 | 0.3675 | Yes |
| 35 | Scamp3 | 5522 | 0.144 | 0.3703 | Yes |
| 36 | Ica1 | 5525 | 0.144 | 0.3788 | Yes |
| 37 | Pam | 5617 | 0.140 | 0.3824 | Yes |
| 38 | Arfgef2 | 5910 | 0.129 | 0.3750 | Yes |
| 39 | Lman1 | 5932 | 0.127 | 0.3814 | Yes |
| 40 | Sec31a | 5969 | 0.125 | 0.3869 | Yes |
| 41 | Ap1g1 | 6119 | 0.120 | 0.3864 | Yes |
| 42 | Arfgef1 | 6184 | 0.117 | 0.3900 | Yes |
| 43 | Copb1 | 6315 | 0.111 | 0.3899 | Yes |
| 44 | Uso1 | 6441 | 0.106 | 0.3897 | Yes |
| 45 | Snx2 | 6617 | 0.098 | 0.3865 | Yes |
| 46 | Mon2 | 6711 | 0.095 | 0.3874 | Yes |
| 47 | Vps45 | 6715 | 0.095 | 0.3928 | Yes |
| 48 | Tom1l1 | 6928 | 0.086 | 0.3870 | Yes |
| 49 | Rer1 | 6946 | 0.086 | 0.3912 | Yes |
| 50 | Mapk1 | 6978 | 0.084 | 0.3946 | Yes |
| 51 | Ap2m1 | 7248 | 0.075 | 0.3851 | No |
| 52 | Tpd52 | 7594 | 0.062 | 0.3711 | No |
| 53 | Vamp4 | 7812 | 0.054 | 0.3631 | No |
| 54 | Rab2a | 8462 | 0.029 | 0.3314 | No |
| 55 | Ap3s1 | 8638 | 0.022 | 0.3237 | No |
| 56 | Stx16 | 8690 | 0.020 | 0.3223 | No |
| 57 | M6pr | 8810 | 0.017 | 0.3172 | No |
| 58 | Clta | 8888 | 0.014 | 0.3140 | No |
| 59 | Sspn | 9275 | 0.000 | 0.2941 | No |
| 60 | Rab14 | 9439 | -0.005 | 0.2860 | No |
| 61 | Ykt6 | 9463 | -0.006 | 0.2852 | No |
| 62 | Tspan8 | 9567 | -0.010 | 0.2804 | No |
| 63 | Arcn1 | 9583 | -0.010 | 0.2803 | No |
| 64 | Arfgap3 | 9614 | -0.011 | 0.2794 | No |
| 65 | Gosr2 | 10166 | -0.031 | 0.2529 | No |
| 66 | Ocrl | 10234 | -0.034 | 0.2514 | No |
| 67 | Sec22b | 10256 | -0.035 | 0.2524 | No |
| 68 | Scamp1 | 10294 | -0.036 | 0.2526 | No |
| 69 | Galc | 10415 | -0.041 | 0.2488 | No |
| 70 | Napa | 10770 | -0.053 | 0.2337 | No |
| 71 | Rab22a | 10846 | -0.057 | 0.2332 | No |
| 72 | Tsg101 | 11005 | -0.061 | 0.2287 | No |
| 73 | Atp7a | 11411 | -0.077 | 0.2124 | No |
| 74 | Rab9 | 11589 | -0.083 | 0.2082 | No |
| 75 | Vamp3 | 11592 | -0.083 | 0.2130 | No |
| 76 | Gbf1 | 11688 | -0.087 | 0.2133 | No |
| 77 | Ergic3 | 11941 | -0.097 | 0.2061 | No |
| 78 | Clcn3 | 11953 | -0.097 | 0.2112 | No |
| 79 | Bnip3 | 11974 | -0.099 | 0.2161 | No |
| 80 | Cln5 | 12230 | -0.109 | 0.2094 | No |
| 81 | Ctsc | 12710 | -0.129 | 0.1923 | No |
| 82 | Krt18 | 13076 | -0.143 | 0.1820 | No |
| 83 | Tmed10 | 13266 | -0.151 | 0.1812 | No |
| 84 | Dop1a | 13550 | -0.164 | 0.1763 | No |
| 85 | Sod1 | 14177 | -0.190 | 0.1553 | No |
| 86 | Igf2r | 14869 | -0.224 | 0.1330 | No |
| 87 | Tmx1 | 15198 | -0.239 | 0.1302 | No |
| 88 | Sec24d | 15317 | -0.247 | 0.1388 | No |
| 89 | Bet1 | 16382 | -0.309 | 0.1022 | No |
| 90 | Gnas | 16630 | -0.324 | 0.1087 | No |
| 91 | Ap2s1 | 16635 | -0.325 | 0.1277 | No |
| 92 | Stx7 | 16917 | -0.345 | 0.1336 | No |