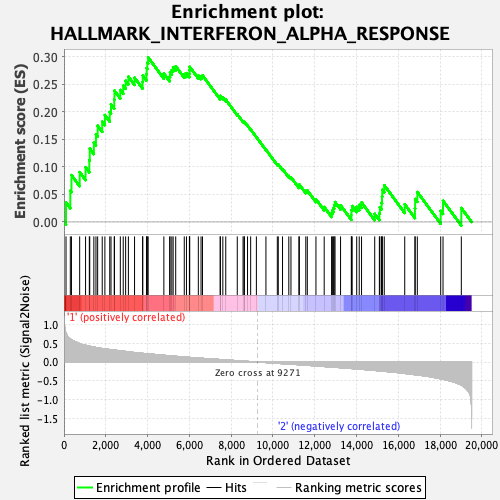
Profile of the Running ES Score & Positions of GeneSet Members on the Rank Ordered List
| Dataset | MPP.MPP_Pheno.cls#Group2_versus_Group3.MPP_Pheno.cls#Group2_versus_Group3_repos |
| Phenotype | MPP_Pheno.cls#Group2_versus_Group3_repos |
| Upregulated in class | 1 |
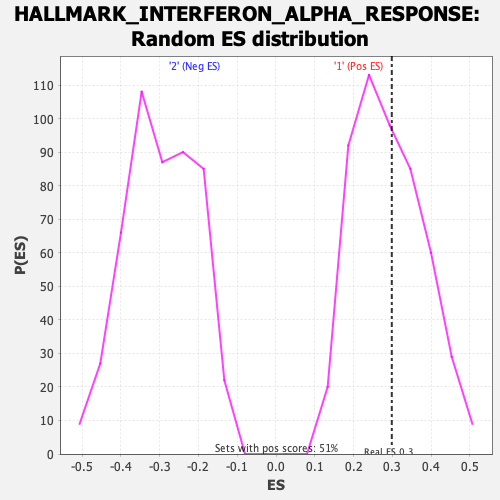
| GeneSet | HALLMARK_INTERFERON_ALPHA_RESPONSE |
| Enrichment Score (ES) | 0.29843992 |
| Normalized Enrichment Score (NES) | 1.0284145 |
| Nominal p-value | 0.43083003 |
| FDR q-value | 1.0 |
| FWER p-Value | 0.994 |
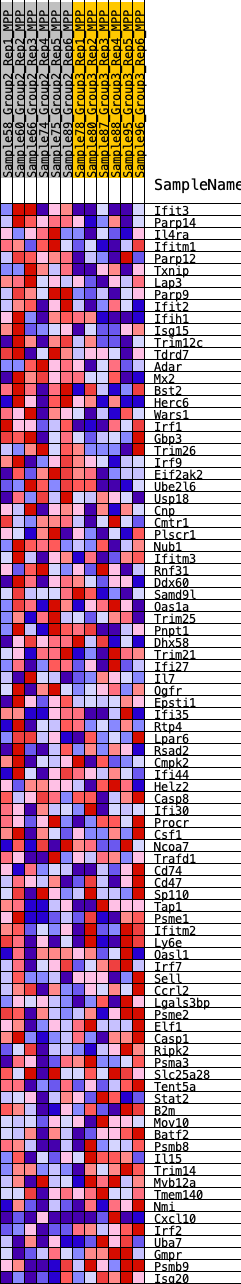
| SYMBOL | RANK IN GENE LIST | RANK METRIC SCORE | RUNNING ES | CORE ENRICHMENT | |
|---|---|---|---|---|---|
| 1 | Ifit3 | 96 | 0.774 | 0.0354 | Yes |
| 2 | Parp14 | 302 | 0.614 | 0.0569 | Yes |
| 3 | Il4ra | 357 | 0.595 | 0.0851 | Yes |
| 4 | Ifitm1 | 750 | 0.490 | 0.0904 | Yes |
| 5 | Parp12 | 1032 | 0.447 | 0.0993 | Yes |
| 6 | Txnip | 1212 | 0.424 | 0.1121 | Yes |
| 7 | Lap3 | 1232 | 0.422 | 0.1331 | Yes |
| 8 | Parp9 | 1429 | 0.397 | 0.1438 | Yes |
| 9 | Ifit2 | 1530 | 0.389 | 0.1589 | Yes |
| 10 | Ifih1 | 1611 | 0.381 | 0.1746 | Yes |
| 11 | Isg15 | 1830 | 0.360 | 0.1821 | Yes |
| 12 | Trim12c | 1957 | 0.352 | 0.1940 | Yes |
| 13 | Tdrd7 | 2190 | 0.334 | 0.1994 | Yes |
| 14 | Adar | 2250 | 0.328 | 0.2135 | Yes |
| 15 | Mx2 | 2406 | 0.318 | 0.2221 | Yes |
| 16 | Bst2 | 2415 | 0.317 | 0.2382 | Yes |
| 17 | Herc6 | 2696 | 0.299 | 0.2394 | Yes |
| 18 | Wars1 | 2835 | 0.289 | 0.2473 | Yes |
| 19 | Irf1 | 2950 | 0.282 | 0.2561 | Yes |
| 20 | Gbp3 | 3082 | 0.273 | 0.2636 | Yes |
| 21 | Trim26 | 3377 | 0.252 | 0.2616 | Yes |
| 22 | Irf9 | 3762 | 0.231 | 0.2539 | Yes |
| 23 | Eif2ak2 | 3770 | 0.231 | 0.2656 | Yes |
| 24 | Ube2l6 | 3948 | 0.222 | 0.2680 | Yes |
| 25 | Usp18 | 3959 | 0.221 | 0.2790 | Yes |
| 26 | Cnp | 3989 | 0.220 | 0.2890 | Yes |
| 27 | Cmtr1 | 4028 | 0.218 | 0.2984 | Yes |
| 28 | Plscr1 | 4780 | 0.181 | 0.2692 | No |
| 29 | Nub1 | 5058 | 0.168 | 0.2637 | No |
| 30 | Ifitm3 | 5077 | 0.167 | 0.2714 | No |
| 31 | Rnf31 | 5162 | 0.162 | 0.2756 | No |
| 32 | Ddx60 | 5224 | 0.159 | 0.2807 | No |
| 33 | Samd9l | 5347 | 0.153 | 0.2824 | No |
| 34 | Oas1a | 5757 | 0.135 | 0.2684 | No |
| 35 | Trim25 | 5862 | 0.131 | 0.2698 | No |
| 36 | Pnpt1 | 6003 | 0.124 | 0.2691 | No |
| 37 | Dhx58 | 6008 | 0.124 | 0.2753 | No |
| 38 | Trim21 | 6018 | 0.123 | 0.2813 | No |
| 39 | Ifi27 | 6430 | 0.106 | 0.2657 | No |
| 40 | Il7 | 6560 | 0.101 | 0.2643 | No |
| 41 | Ogfr | 6629 | 0.098 | 0.2659 | No |
| 42 | Epsti1 | 7474 | 0.067 | 0.2259 | No |
| 43 | Ifi35 | 7487 | 0.066 | 0.2287 | No |
| 44 | Rtp4 | 7603 | 0.062 | 0.2261 | No |
| 45 | Lpar6 | 7743 | 0.057 | 0.2219 | No |
| 46 | Rsad2 | 8294 | 0.036 | 0.1954 | No |
| 47 | Cmpk2 | 8571 | 0.025 | 0.1825 | No |
| 48 | Ifi44 | 8623 | 0.023 | 0.1810 | No |
| 49 | Helz2 | 8635 | 0.022 | 0.1816 | No |
| 50 | Casp8 | 8785 | 0.017 | 0.1748 | No |
| 51 | Ifi30 | 8935 | 0.013 | 0.1678 | No |
| 52 | Procr | 9209 | 0.003 | 0.1539 | No |
| 53 | Csf1 | 9666 | -0.013 | 0.1311 | No |
| 54 | Ncoa7 | 10211 | -0.033 | 0.1048 | No |
| 55 | Trafd1 | 10257 | -0.035 | 0.1043 | No |
| 56 | Cd74 | 10460 | -0.042 | 0.0961 | No |
| 57 | Cd47 | 10761 | -0.052 | 0.0834 | No |
| 58 | Sp110 | 10864 | -0.057 | 0.0811 | No |
| 59 | Tap1 | 11244 | -0.071 | 0.0653 | No |
| 60 | Psme1 | 11265 | -0.071 | 0.0680 | No |
| 61 | Ifitm2 | 11574 | -0.083 | 0.0564 | No |
| 62 | Ly6e | 11647 | -0.085 | 0.0572 | No |
| 63 | Oasl1 | 12060 | -0.102 | 0.0413 | No |
| 64 | Irf7 | 12455 | -0.118 | 0.0272 | No |
| 65 | Sell | 12809 | -0.133 | 0.0159 | No |
| 66 | Ccrl2 | 12847 | -0.134 | 0.0210 | No |
| 67 | Lgals3bp | 12906 | -0.137 | 0.0252 | No |
| 68 | Psme2 | 12932 | -0.138 | 0.0310 | No |
| 69 | Elf1 | 12974 | -0.139 | 0.0362 | No |
| 70 | Casp1 | 13238 | -0.149 | 0.0304 | No |
| 71 | Ripk2 | 13756 | -0.172 | 0.0128 | No |
| 72 | Psma3 | 13758 | -0.172 | 0.0217 | No |
| 73 | Slc25a28 | 13794 | -0.174 | 0.0290 | No |
| 74 | Tent5a | 14011 | -0.183 | 0.0274 | No |
| 75 | Stat2 | 14132 | -0.189 | 0.0310 | No |
| 76 | B2m | 14243 | -0.194 | 0.0355 | No |
| 77 | Mov10 | 14873 | -0.224 | 0.0148 | No |
| 78 | Batf2 | 15096 | -0.234 | 0.0156 | No |
| 79 | Psmb8 | 15119 | -0.236 | 0.0267 | No |
| 80 | Il15 | 15200 | -0.240 | 0.0351 | No |
| 81 | Trim14 | 15223 | -0.241 | 0.0465 | No |
| 82 | Mvb12a | 15237 | -0.243 | 0.0585 | No |
| 83 | Tmem140 | 15330 | -0.247 | 0.0667 | No |
| 84 | Nmi | 16310 | -0.304 | 0.0321 | No |
| 85 | Cxcl10 | 16799 | -0.337 | 0.0246 | No |
| 86 | Irf2 | 16809 | -0.338 | 0.0417 | No |
| 87 | Uba7 | 16913 | -0.345 | 0.0543 | No |
| 88 | Gmpr | 18032 | -0.448 | 0.0201 | No |
| 89 | Psmb9 | 18143 | -0.461 | 0.0385 | No |
| 90 | Isg20 | 19019 | -0.613 | 0.0254 | No |