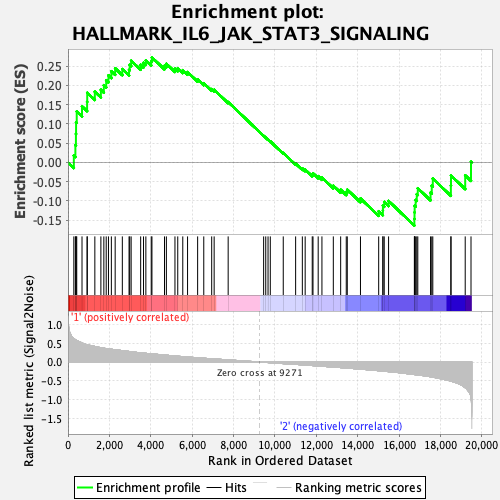
Profile of the Running ES Score & Positions of GeneSet Members on the Rank Ordered List
| Dataset | MPP.MPP_Pheno.cls#Group2_versus_Group3.MPP_Pheno.cls#Group2_versus_Group3_repos |
| Phenotype | MPP_Pheno.cls#Group2_versus_Group3_repos |
| Upregulated in class | 1 |
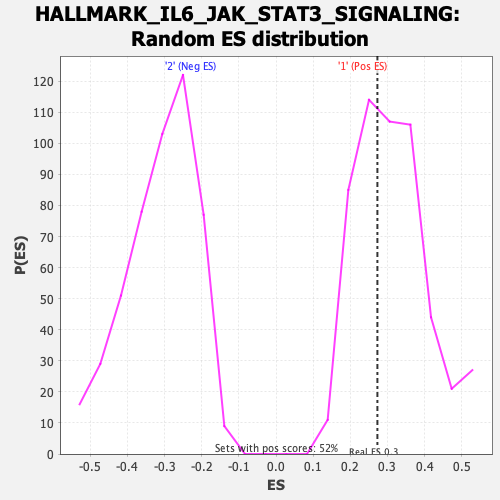
| GeneSet | HALLMARK_IL6_JAK_STAT3_SIGNALING |
| Enrichment Score (ES) | 0.2728574 |
| Normalized Enrichment Score (NES) | 0.8813855 |
| Nominal p-value | 0.6097087 |
| FDR q-value | 1.0 |
| FWER p-Value | 1.0 |
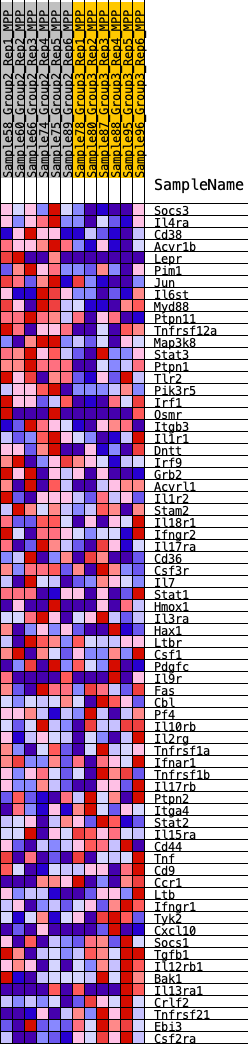
| SYMBOL | RANK IN GENE LIST | RANK METRIC SCORE | RUNNING ES | CORE ENRICHMENT | |
|---|---|---|---|---|---|
| 1 | Socs3 | 282 | 0.621 | 0.0179 | Yes |
| 2 | Il4ra | 357 | 0.595 | 0.0450 | Yes |
| 3 | Cd38 | 383 | 0.584 | 0.0742 | Yes |
| 4 | Acvr1b | 391 | 0.581 | 0.1041 | Yes |
| 5 | Lepr | 422 | 0.574 | 0.1325 | Yes |
| 6 | Pim1 | 677 | 0.508 | 0.1459 | Yes |
| 7 | Jun | 923 | 0.462 | 0.1573 | Yes |
| 8 | Il6st | 930 | 0.461 | 0.1810 | Yes |
| 9 | Myd88 | 1297 | 0.414 | 0.1838 | Yes |
| 10 | Ptpn11 | 1589 | 0.383 | 0.1888 | Yes |
| 11 | Tnfrsf12a | 1732 | 0.369 | 0.2007 | Yes |
| 12 | Map3k8 | 1846 | 0.359 | 0.2135 | Yes |
| 13 | Stat3 | 1955 | 0.352 | 0.2263 | Yes |
| 14 | Ptpn1 | 2095 | 0.341 | 0.2369 | Yes |
| 15 | Tlr2 | 2279 | 0.327 | 0.2445 | Yes |
| 16 | Pik3r5 | 2625 | 0.303 | 0.2426 | Yes |
| 17 | Irf1 | 2950 | 0.282 | 0.2406 | Yes |
| 18 | Osmr | 2982 | 0.279 | 0.2535 | Yes |
| 19 | Itgb3 | 3051 | 0.276 | 0.2644 | Yes |
| 20 | Il1r1 | 3511 | 0.245 | 0.2536 | Yes |
| 21 | Dntt | 3649 | 0.238 | 0.2589 | Yes |
| 22 | Irf9 | 3762 | 0.231 | 0.2652 | Yes |
| 23 | Grb2 | 4021 | 0.219 | 0.2633 | Yes |
| 24 | Acvrl1 | 4056 | 0.217 | 0.2729 | Yes |
| 25 | Il1r2 | 4663 | 0.187 | 0.2514 | No |
| 26 | Stam2 | 4753 | 0.183 | 0.2563 | No |
| 27 | Il18r1 | 5168 | 0.162 | 0.2435 | No |
| 28 | Ifngr2 | 5303 | 0.155 | 0.2447 | No |
| 29 | Il17ra | 5546 | 0.143 | 0.2397 | No |
| 30 | Cd36 | 5777 | 0.134 | 0.2348 | No |
| 31 | Csf3r | 6264 | 0.113 | 0.2157 | No |
| 32 | Il7 | 6560 | 0.101 | 0.2058 | No |
| 33 | Stat1 | 6943 | 0.086 | 0.1906 | No |
| 34 | Hmox1 | 7062 | 0.081 | 0.1888 | No |
| 35 | Il3ra | 7739 | 0.057 | 0.1570 | No |
| 36 | Hax1 | 9453 | -0.005 | 0.0692 | No |
| 37 | Ltbr | 9555 | -0.009 | 0.0644 | No |
| 38 | Csf1 | 9666 | -0.013 | 0.0595 | No |
| 39 | Pdgfc | 9775 | -0.017 | 0.0548 | No |
| 40 | Il9r | 10401 | -0.041 | 0.0247 | No |
| 41 | Fas | 10999 | -0.061 | -0.0028 | No |
| 42 | Cbl | 11323 | -0.073 | -0.0156 | No |
| 43 | Pf4 | 11460 | -0.079 | -0.0185 | No |
| 44 | Il10rb | 11801 | -0.093 | -0.0312 | No |
| 45 | Il2rg | 11838 | -0.094 | -0.0281 | No |
| 46 | Tnfrsf1a | 12089 | -0.103 | -0.0356 | No |
| 47 | Ifnar1 | 12270 | -0.111 | -0.0391 | No |
| 48 | Tnfrsf1b | 12820 | -0.133 | -0.0604 | No |
| 49 | Il17rb | 13175 | -0.148 | -0.0709 | No |
| 50 | Ptpn2 | 13445 | -0.158 | -0.0765 | No |
| 51 | Itga4 | 13495 | -0.161 | -0.0706 | No |
| 52 | Stat2 | 14132 | -0.189 | -0.0935 | No |
| 53 | Il15ra | 15012 | -0.230 | -0.1267 | No |
| 54 | Cd44 | 15214 | -0.241 | -0.1245 | No |
| 55 | Tnf | 15218 | -0.241 | -0.1121 | No |
| 56 | Cd9 | 15280 | -0.245 | -0.1025 | No |
| 57 | Ccr1 | 15490 | -0.255 | -0.0999 | No |
| 58 | Ltb | 16736 | -0.333 | -0.1466 | No |
| 59 | Ifngr1 | 16744 | -0.333 | -0.1297 | No |
| 60 | Tyk2 | 16751 | -0.334 | -0.1126 | No |
| 61 | Cxcl10 | 16799 | -0.337 | -0.0974 | No |
| 62 | Socs1 | 16853 | -0.340 | -0.0824 | No |
| 63 | Tgfb1 | 16902 | -0.344 | -0.0670 | No |
| 64 | Il12rb1 | 17518 | -0.392 | -0.0782 | No |
| 65 | Bak1 | 17577 | -0.399 | -0.0604 | No |
| 66 | Il13ra1 | 17627 | -0.404 | -0.0419 | No |
| 67 | Crlf2 | 18500 | -0.508 | -0.0602 | No |
| 68 | Tnfrsf21 | 18507 | -0.510 | -0.0340 | No |
| 69 | Ebi3 | 19193 | -0.684 | -0.0336 | No |
| 70 | Csf2ra | 19473 | -0.958 | 0.0020 | No |