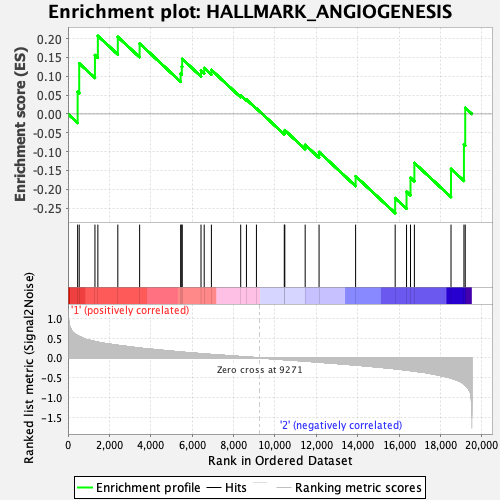
Profile of the Running ES Score & Positions of GeneSet Members on the Rank Ordered List
| Dataset | MPP.MPP_Pheno.cls#Group2_versus_Group3.MPP_Pheno.cls#Group2_versus_Group3_repos |
| Phenotype | MPP_Pheno.cls#Group2_versus_Group3_repos |
| Upregulated in class | 2 |
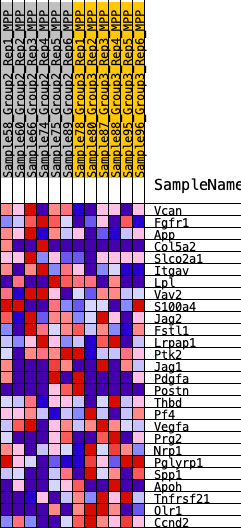
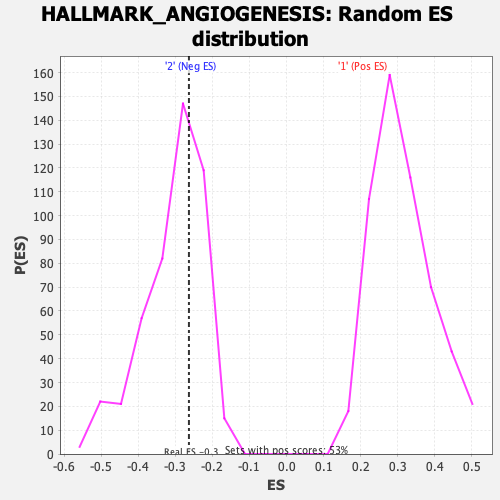
| GeneSet | HALLMARK_ANGIOGENESIS |
| Enrichment Score (ES) | -0.26346427 |
| Normalized Enrichment Score (NES) | -0.86079305 |
| Nominal p-value | 0.6695279 |
| FDR q-value | 1.0 |
| FWER p-Value | 1.0 |
| SYMBOL | RANK IN GENE LIST | RANK METRIC SCORE | RUNNING ES | CORE ENRICHMENT | |
|---|---|---|---|---|---|
| 1 | Vcan | 466 | 0.563 | 0.0589 | No |
| 2 | Fgfr1 | 542 | 0.541 | 0.1345 | No |
| 3 | App | 1302 | 0.414 | 0.1564 | No |
| 4 | Col5a2 | 1443 | 0.396 | 0.2074 | No |
| 5 | Slco2a1 | 2407 | 0.318 | 0.2047 | No |
| 6 | Itgav | 3461 | 0.248 | 0.1871 | No |
| 7 | Lpl | 5443 | 0.148 | 0.1073 | No |
| 8 | Vav2 | 5498 | 0.146 | 0.1259 | No |
| 9 | S100a4 | 5517 | 0.145 | 0.1463 | No |
| 10 | Jag2 | 6427 | 0.107 | 0.1153 | No |
| 11 | Fstl1 | 6581 | 0.100 | 0.1221 | No |
| 12 | Lrpap1 | 6929 | 0.086 | 0.1170 | No |
| 13 | Ptk2 | 8345 | 0.033 | 0.0493 | No |
| 14 | Jag1 | 8622 | 0.023 | 0.0384 | No |
| 15 | Pdgfa | 9105 | 0.007 | 0.0147 | No |
| 16 | Postn | 10451 | -0.042 | -0.0482 | No |
| 17 | Thbd | 10476 | -0.043 | -0.0431 | No |
| 18 | Pf4 | 11460 | -0.079 | -0.0820 | No |
| 19 | Vegfa | 12131 | -0.105 | -0.1010 | No |
| 20 | Prg2 | 13897 | -0.178 | -0.1654 | No |
| 21 | Nrp1 | 15809 | -0.272 | -0.2235 | Yes |
| 22 | Pglyrp1 | 16358 | -0.307 | -0.2065 | Yes |
| 23 | Spp1 | 16549 | -0.319 | -0.1694 | Yes |
| 24 | Apoh | 16737 | -0.333 | -0.1301 | Yes |
| 25 | Tnfrsf21 | 18507 | -0.510 | -0.1459 | Yes |
| 26 | Olr1 | 19132 | -0.659 | -0.0811 | Yes |
| 27 | Ccnd2 | 19194 | -0.684 | 0.0163 | Yes |