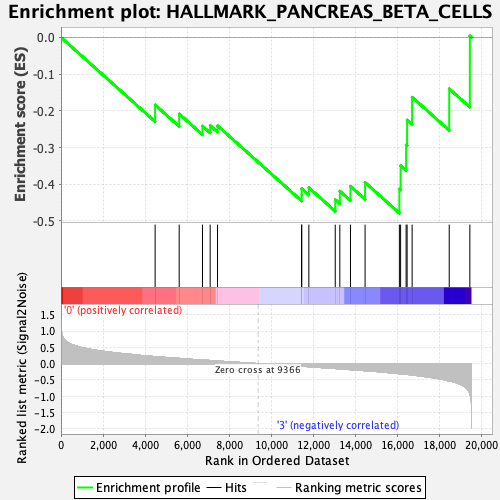
Profile of the Running ES Score & Positions of GeneSet Members on the Rank Ordered List
| Dataset | MPP.MPP_Pheno.cls#Group1_versus_Group4.MPP_Pheno.cls#Group1_versus_Group4_repos |
| Phenotype | MPP_Pheno.cls#Group1_versus_Group4_repos |
| Upregulated in class | 3 |
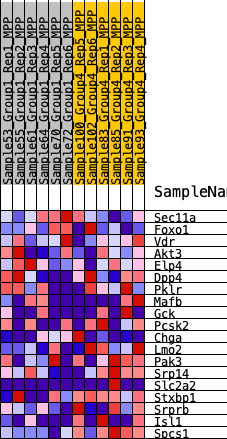
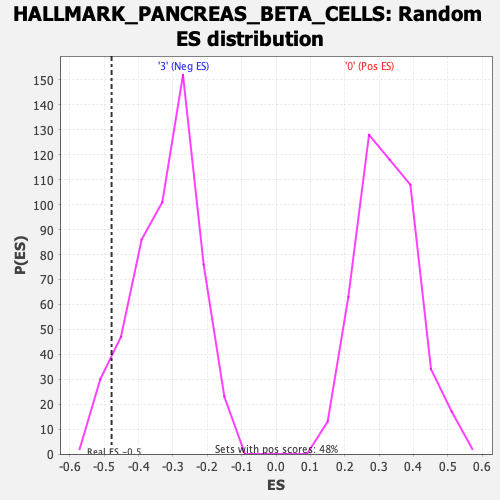
| GeneSet | HALLMARK_PANCREAS_BETA_CELLS |
| Enrichment Score (ES) | -0.47861123 |
| Normalized Enrichment Score (NES) | -1.494746 |
| Nominal p-value | 0.065764025 |
| FDR q-value | 0.25229093 |
| FWER p-Value | 0.429 |
| SYMBOL | RANK IN GENE LIST | RANK METRIC SCORE | RUNNING ES | CORE ENRICHMENT | |
|---|---|---|---|---|---|
| 1 | Sec11a | 4474 | 0.213 | -0.1840 | No |
| 2 | Foxo1 | 5618 | 0.160 | -0.2084 | No |
| 3 | Vdr | 6725 | 0.110 | -0.2416 | No |
| 4 | Akt3 | 7090 | 0.095 | -0.2399 | No |
| 5 | Elp4 | 7440 | 0.081 | -0.2405 | No |
| 6 | Dpp4 | 11439 | -0.079 | -0.4287 | No |
| 7 | Pklr | 11441 | -0.079 | -0.4118 | No |
| 8 | Mafb | 11782 | -0.093 | -0.4093 | No |
| 9 | Gck | 13036 | -0.149 | -0.4417 | Yes |
| 10 | Pcsk2 | 13254 | -0.160 | -0.4186 | Yes |
| 11 | Chga | 13760 | -0.182 | -0.4055 | Yes |
| 12 | Lmo2 | 14454 | -0.215 | -0.3950 | Yes |
| 13 | Pak3 | 16085 | -0.308 | -0.4127 | Yes |
| 14 | Srp14 | 16143 | -0.309 | -0.3493 | Yes |
| 15 | Slc2a2 | 16405 | -0.326 | -0.2930 | Yes |
| 16 | Stxbp1 | 16452 | -0.328 | -0.2249 | Yes |
| 17 | Srprb | 16691 | -0.346 | -0.1629 | Yes |
| 18 | Isl1 | 18454 | -0.529 | -0.1399 | Yes |
| 19 | Spcs1 | 19435 | -0.906 | 0.0039 | Yes |