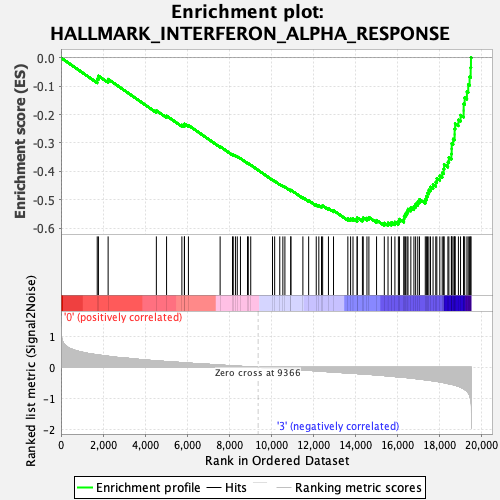
Profile of the Running ES Score & Positions of GeneSet Members on the Rank Ordered List
| Dataset | MPP.MPP_Pheno.cls#Group1_versus_Group4.MPP_Pheno.cls#Group1_versus_Group4_repos |
| Phenotype | MPP_Pheno.cls#Group1_versus_Group4_repos |
| Upregulated in class | 3 |
| GeneSet | HALLMARK_INTERFERON_ALPHA_RESPONSE |
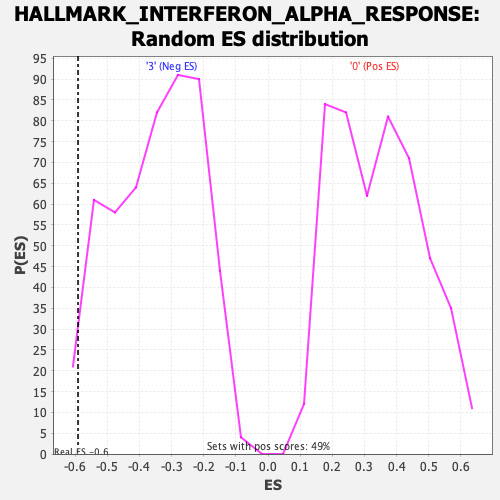
| Enrichment Score (ES) | -0.59090626 |
| Normalized Enrichment Score (NES) | -1.70092 |
| Nominal p-value | 0.031067962 |
| FDR q-value | 0.09387648 |
| FWER p-Value | 0.113 |
| SYMBOL | RANK IN GENE LIST | RANK METRIC SCORE | RUNNING ES | CORE ENRICHMENT | |
|---|---|---|---|---|---|
| 1 | Cxcl10 | 1722 | 0.404 | -0.0747 | No |
| 2 | Ifit2 | 1779 | 0.399 | -0.0638 | No |
| 3 | Wars1 | 2240 | 0.358 | -0.0752 | No |
| 4 | Parp14 | 4533 | 0.210 | -0.1860 | No |
| 5 | Cmtr1 | 5018 | 0.186 | -0.2045 | No |
| 6 | Trafd1 | 5746 | 0.153 | -0.2366 | No |
| 7 | Adar | 5865 | 0.147 | -0.2376 | No |
| 8 | Trim25 | 5869 | 0.147 | -0.2327 | No |
| 9 | Elf1 | 6057 | 0.138 | -0.2376 | No |
| 10 | Tmem140 | 7564 | 0.076 | -0.3125 | No |
| 11 | Nub1 | 8152 | 0.050 | -0.3410 | No |
| 12 | Psme2 | 8187 | 0.049 | -0.3411 | No |
| 13 | Irf1 | 8292 | 0.044 | -0.3449 | No |
| 14 | Tent5a | 8379 | 0.041 | -0.3480 | No |
| 15 | Cmpk2 | 8530 | 0.034 | -0.3545 | No |
| 16 | Lap3 | 8866 | 0.021 | -0.3710 | No |
| 17 | Stat2 | 8902 | 0.019 | -0.3722 | No |
| 18 | Slc25a28 | 9019 | 0.014 | -0.3776 | No |
| 19 | Uba7 | 10054 | -0.023 | -0.4301 | No |
| 20 | Sp110 | 10156 | -0.027 | -0.4343 | No |
| 21 | Parp9 | 10399 | -0.037 | -0.4455 | No |
| 22 | Trim21 | 10546 | -0.043 | -0.4516 | No |
| 23 | Ifi30 | 10643 | -0.046 | -0.4549 | No |
| 24 | Ncoa7 | 10922 | -0.057 | -0.4673 | No |
| 25 | Trim26 | 10927 | -0.057 | -0.4655 | No |
| 26 | Mov10 | 11498 | -0.081 | -0.4920 | No |
| 27 | Txnip | 11772 | -0.093 | -0.5029 | No |
| 28 | Pnpt1 | 12133 | -0.108 | -0.5177 | No |
| 29 | Cd47 | 12256 | -0.114 | -0.5200 | No |
| 30 | Rnf31 | 12383 | -0.120 | -0.5224 | No |
| 31 | Psma3 | 12437 | -0.123 | -0.5208 | No |
| 32 | Ripk2 | 12713 | -0.137 | -0.5303 | No |
| 33 | Dhx58 | 12954 | -0.145 | -0.5376 | No |
| 34 | Ifi35 | 13635 | -0.178 | -0.5665 | No |
| 35 | Cnp | 13766 | -0.182 | -0.5669 | No |
| 36 | Csf1 | 13880 | -0.188 | -0.5663 | No |
| 37 | Irf2 | 14078 | -0.197 | -0.5696 | No |
| 38 | Eif2ak2 | 14080 | -0.198 | -0.5629 | No |
| 39 | Il4ra | 14328 | -0.209 | -0.5684 | No |
| 40 | Helz2 | 14367 | -0.211 | -0.5631 | No |
| 41 | Tap1 | 14543 | -0.219 | -0.5645 | No |
| 42 | Casp8 | 14636 | -0.222 | -0.5616 | No |
| 43 | Gbp3 | 15000 | -0.241 | -0.5720 | No |
| 44 | Irf7 | 15369 | -0.262 | -0.5819 | Yes |
| 45 | Samd9l | 15545 | -0.273 | -0.5814 | Yes |
| 46 | Sell | 15706 | -0.285 | -0.5799 | Yes |
| 47 | Nmi | 15872 | -0.294 | -0.5782 | Yes |
| 48 | Epsti1 | 16037 | -0.304 | -0.5762 | Yes |
| 49 | Ccrl2 | 16088 | -0.308 | -0.5681 | Yes |
| 50 | Il15 | 16299 | -0.320 | -0.5679 | Yes |
| 51 | Psmb9 | 16310 | -0.321 | -0.5574 | Yes |
| 52 | Ifih1 | 16371 | -0.324 | -0.5493 | Yes |
| 53 | Ogfr | 16447 | -0.328 | -0.5418 | Yes |
| 54 | Ifit3 | 16494 | -0.332 | -0.5327 | Yes |
| 55 | Rsad2 | 16630 | -0.342 | -0.5279 | Yes |
| 56 | Il7 | 16776 | -0.353 | -0.5231 | Yes |
| 57 | Ifitm2 | 16858 | -0.359 | -0.5149 | Yes |
| 58 | Mx2 | 16959 | -0.368 | -0.5074 | Yes |
| 59 | Irf9 | 17040 | -0.376 | -0.4985 | Yes |
| 60 | Herc6 | 17316 | -0.398 | -0.4990 | Yes |
| 61 | Plscr1 | 17369 | -0.403 | -0.4877 | Yes |
| 62 | Bst2 | 17419 | -0.407 | -0.4762 | Yes |
| 63 | Procr | 17486 | -0.412 | -0.4654 | Yes |
| 64 | Isg20 | 17563 | -0.419 | -0.4549 | Yes |
| 65 | Ube2l6 | 17686 | -0.430 | -0.4463 | Yes |
| 66 | Casp1 | 17815 | -0.445 | -0.4376 | Yes |
| 67 | Psmb8 | 17865 | -0.451 | -0.4245 | Yes |
| 68 | Batf2 | 18006 | -0.465 | -0.4157 | Yes |
| 69 | Parp12 | 18121 | -0.478 | -0.4051 | Yes |
| 70 | Ddx60 | 18189 | -0.488 | -0.3917 | Yes |
| 71 | Ifitm1 | 18212 | -0.492 | -0.3759 | Yes |
| 72 | Cd74 | 18392 | -0.521 | -0.3671 | Yes |
| 73 | Lpar6 | 18438 | -0.527 | -0.3512 | Yes |
| 74 | Trim12c | 18555 | -0.542 | -0.3385 | Yes |
| 75 | Psme1 | 18571 | -0.544 | -0.3205 | Yes |
| 76 | Mvb12a | 18574 | -0.545 | -0.3018 | Yes |
| 77 | Ifitm3 | 18639 | -0.556 | -0.2859 | Yes |
| 78 | Tdrd7 | 18711 | -0.568 | -0.2700 | Yes |
| 79 | Trim14 | 18712 | -0.568 | -0.2504 | Yes |
| 80 | Ifi44 | 18736 | -0.573 | -0.2319 | Yes |
| 81 | Oas1a | 18891 | -0.609 | -0.2188 | Yes |
| 82 | Oasl1 | 18992 | -0.636 | -0.2020 | Yes |
| 83 | Gmpr | 19140 | -0.683 | -0.1860 | Yes |
| 84 | Ifi27 | 19141 | -0.683 | -0.1624 | Yes |
| 85 | Usp18 | 19189 | -0.708 | -0.1404 | Yes |
| 86 | Lgals3bp | 19296 | -0.769 | -0.1194 | Yes |
| 87 | Ly6e | 19358 | -0.813 | -0.0945 | Yes |
| 88 | B2m | 19422 | -0.884 | -0.0672 | Yes |
| 89 | Isg15 | 19474 | -1.022 | -0.0346 | Yes |
| 90 | Rtp4 | 19488 | -1.059 | 0.0012 | Yes |