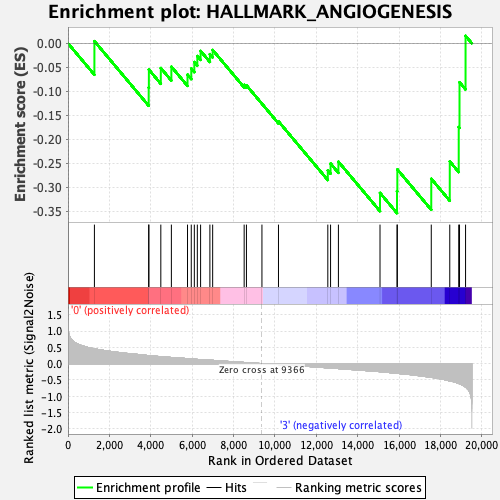
Profile of the Running ES Score & Positions of GeneSet Members on the Rank Ordered List
| Dataset | MPP.MPP_Pheno.cls#Group1_versus_Group4.MPP_Pheno.cls#Group1_versus_Group4_repos |
| Phenotype | MPP_Pheno.cls#Group1_versus_Group4_repos |
| Upregulated in class | 3 |
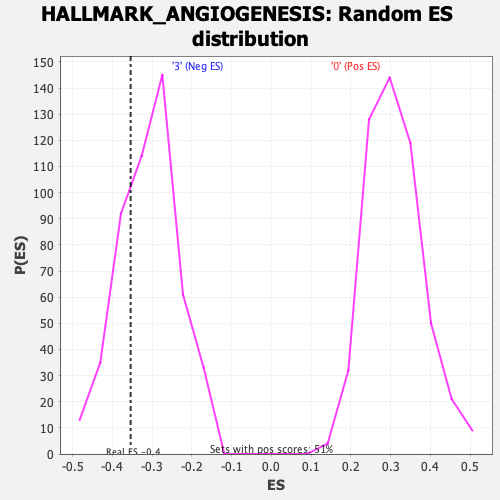
| GeneSet | HALLMARK_ANGIOGENESIS |
| Enrichment Score (ES) | -0.3538554 |
| Normalized Enrichment Score (NES) | -1.1471946 |
| Nominal p-value | 0.27586207 |
| FDR q-value | 0.5876339 |
| FWER p-Value | 0.985 |
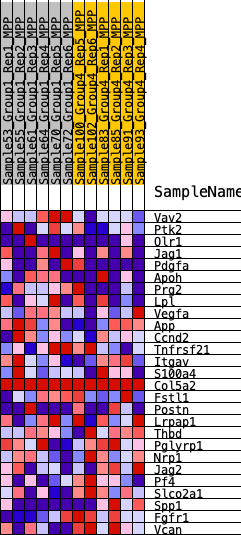
| SYMBOL | RANK IN GENE LIST | RANK METRIC SCORE | RUNNING ES | CORE ENRICHMENT | |
|---|---|---|---|---|---|
| 1 | Vav2 | 1276 | 0.452 | 0.0044 | No |
| 2 | Ptk2 | 3899 | 0.245 | -0.0922 | No |
| 3 | Olr1 | 3908 | 0.244 | -0.0549 | No |
| 4 | Jag1 | 4485 | 0.212 | -0.0516 | No |
| 5 | Pdgfa | 4995 | 0.187 | -0.0487 | No |
| 6 | Apoh | 5775 | 0.151 | -0.0653 | No |
| 7 | Prg2 | 5956 | 0.143 | -0.0525 | No |
| 8 | Lpl | 6104 | 0.135 | -0.0390 | No |
| 9 | Vegfa | 6249 | 0.128 | -0.0265 | No |
| 10 | App | 6407 | 0.120 | -0.0159 | No |
| 11 | Ccnd2 | 6856 | 0.106 | -0.0226 | No |
| 12 | Tnfrsf21 | 6990 | 0.100 | -0.0139 | No |
| 13 | Itgav | 8512 | 0.035 | -0.0866 | No |
| 14 | S100a4 | 8622 | 0.030 | -0.0875 | No |
| 15 | Col5a2 | 9371 | 0.000 | -0.1259 | No |
| 16 | Fstl1 | 10170 | -0.027 | -0.1626 | No |
| 17 | Postn | 12554 | -0.130 | -0.2648 | No |
| 18 | Lrpap1 | 12687 | -0.136 | -0.2505 | No |
| 19 | Thbd | 13066 | -0.150 | -0.2467 | No |
| 20 | Pglyrp1 | 15076 | -0.246 | -0.3117 | Yes |
| 21 | Nrp1 | 15898 | -0.296 | -0.3080 | Yes |
| 22 | Jag2 | 15914 | -0.297 | -0.2628 | Yes |
| 23 | Pf4 | 17553 | -0.417 | -0.2822 | Yes |
| 24 | Slco2a1 | 18447 | -0.529 | -0.2462 | Yes |
| 25 | Spp1 | 18880 | -0.606 | -0.1744 | Yes |
| 26 | Fgfr1 | 18918 | -0.614 | -0.0812 | Yes |
| 27 | Vcan | 19210 | -0.721 | 0.0155 | Yes |