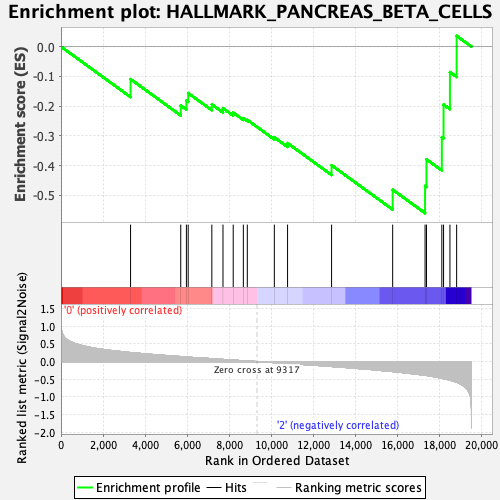
Profile of the Running ES Score & Positions of GeneSet Members on the Rank Ordered List
| Dataset | MPP.MPP_Pheno.cls#Group1_versus_Group3.MPP_Pheno.cls#Group1_versus_Group3_repos |
| Phenotype | MPP_Pheno.cls#Group1_versus_Group3_repos |
| Upregulated in class | 2 |
| GeneSet | HALLMARK_PANCREAS_BETA_CELLS |
| Enrichment Score (ES) | -0.56035006 |
| Normalized Enrichment Score (NES) | -1.6619526 |
| Nominal p-value | 0.005859375 |
| FDR q-value | 0.37324867 |
| FWER p-Value | 0.171 |
| SYMBOL | RANK IN GENE LIST | RANK METRIC SCORE | RUNNING ES | CORE ENRICHMENT | |
|---|---|---|---|---|---|
| 1 | Dpp4 | 3307 | 0.254 | -0.1094 | No |
| 2 | Srprb | 5692 | 0.141 | -0.1983 | No |
| 3 | Akt3 | 5961 | 0.128 | -0.1817 | No |
| 4 | Isl1 | 6046 | 0.125 | -0.1564 | No |
| 5 | Foxo1 | 7170 | 0.082 | -0.1945 | No |
| 6 | Elp4 | 7700 | 0.061 | -0.2072 | No |
| 7 | Vdr | 8186 | 0.043 | -0.2220 | No |
| 8 | Sec11a | 8668 | 0.024 | -0.2409 | No |
| 9 | Pcsk2 | 8856 | 0.017 | -0.2465 | No |
| 10 | Chga | 10141 | -0.030 | -0.3053 | No |
| 11 | Mafb | 10770 | -0.054 | -0.3247 | No |
| 12 | Stxbp1 | 12862 | -0.138 | -0.3992 | No |
| 13 | Gck | 15766 | -0.282 | -0.4814 | Yes |
| 14 | Slc2a2 | 17306 | -0.386 | -0.4688 | Yes |
| 15 | Lmo2 | 17373 | -0.393 | -0.3792 | Yes |
| 16 | Spcs1 | 18103 | -0.472 | -0.3049 | Yes |
| 17 | Pak3 | 18185 | -0.483 | -0.1948 | Yes |
| 18 | Srp14 | 18488 | -0.526 | -0.0857 | Yes |
| 19 | Pklr | 18807 | -0.584 | 0.0362 | Yes |

