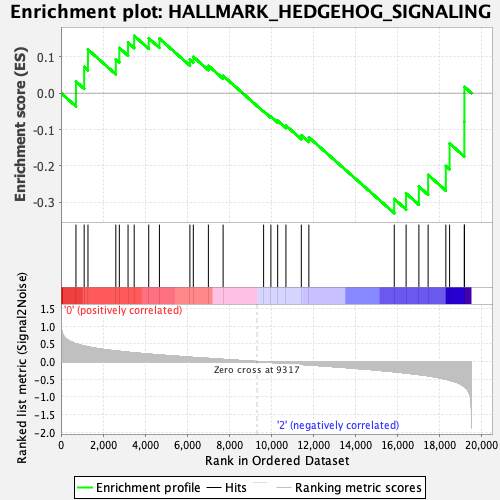
Profile of the Running ES Score & Positions of GeneSet Members on the Rank Ordered List
| Dataset | MPP.MPP_Pheno.cls#Group1_versus_Group3.MPP_Pheno.cls#Group1_versus_Group3_repos |
| Phenotype | MPP_Pheno.cls#Group1_versus_Group3_repos |
| Upregulated in class | 2 |
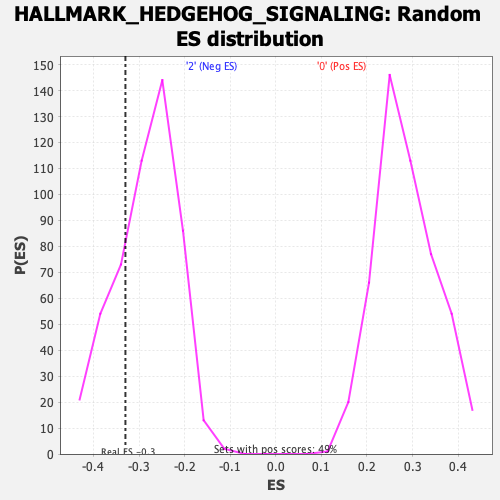
| GeneSet | HALLMARK_HEDGEHOG_SIGNALING |
| Enrichment Score (ES) | -0.32980907 |
| Normalized Enrichment Score (NES) | -1.1602776 |
| Nominal p-value | 0.24703558 |
| FDR q-value | 1.0 |
| FWER p-Value | 0.98 |
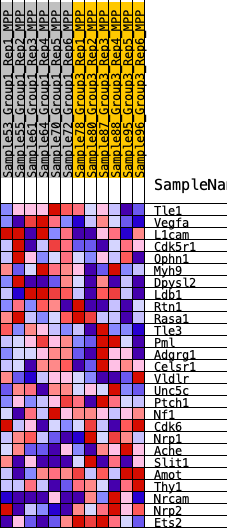
| SYMBOL | RANK IN GENE LIST | RANK METRIC SCORE | RUNNING ES | CORE ENRICHMENT | |
|---|---|---|---|---|---|
| 1 | Tle1 | 711 | 0.501 | 0.0318 | No |
| 2 | Vegfa | 1101 | 0.441 | 0.0720 | No |
| 3 | L1cam | 1282 | 0.416 | 0.1195 | No |
| 4 | Cdk5r1 | 2606 | 0.302 | 0.0929 | No |
| 5 | Ophn1 | 2773 | 0.291 | 0.1241 | No |
| 6 | Myh9 | 3187 | 0.262 | 0.1387 | No |
| 7 | Dpysl2 | 3479 | 0.246 | 0.1573 | No |
| 8 | Ldb1 | 4170 | 0.210 | 0.1505 | No |
| 9 | Rtn1 | 4679 | 0.186 | 0.1498 | No |
| 10 | Rasa1 | 6127 | 0.122 | 0.0922 | No |
| 11 | Tle3 | 6290 | 0.116 | 0.0998 | No |
| 12 | Pml | 7006 | 0.089 | 0.0752 | No |
| 13 | Adgrg1 | 7706 | 0.060 | 0.0475 | No |
| 14 | Celsr1 | 9631 | -0.010 | -0.0498 | No |
| 15 | Vldlr | 9977 | -0.023 | -0.0644 | No |
| 16 | Unc5c | 10299 | -0.036 | -0.0760 | No |
| 17 | Ptch1 | 10692 | -0.051 | -0.0891 | No |
| 18 | Nf1 | 11424 | -0.079 | -0.1159 | No |
| 19 | Cdk6 | 11782 | -0.093 | -0.1216 | No |
| 20 | Nrp1 | 15841 | -0.285 | -0.2909 | Yes |
| 21 | Ache | 16405 | -0.324 | -0.2756 | Yes |
| 22 | Slit1 | 17012 | -0.366 | -0.2569 | Yes |
| 23 | Amot | 17451 | -0.400 | -0.2247 | Yes |
| 24 | Thy1 | 18293 | -0.496 | -0.2002 | Yes |
| 25 | Nrcam | 18472 | -0.522 | -0.1382 | Yes |
| 26 | Nrp2 | 19172 | -0.701 | -0.0785 | Yes |
| 27 | Ets2 | 19176 | -0.703 | 0.0172 | Yes |