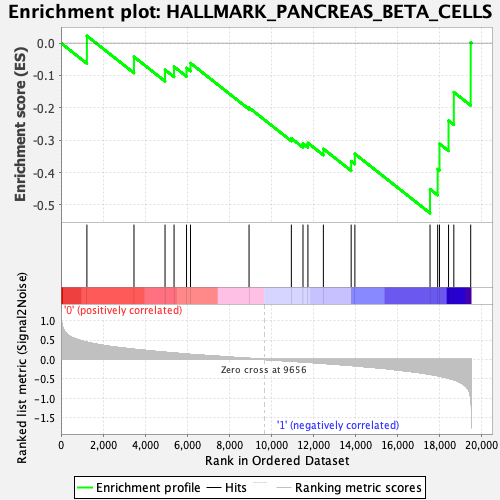
Profile of the Running ES Score & Positions of GeneSet Members on the Rank Ordered List
| Dataset | MPP.MPP_Pheno.cls#Group1_versus_Group2.MPP_Pheno.cls#Group1_versus_Group2_repos |
| Phenotype | MPP_Pheno.cls#Group1_versus_Group2_repos |
| Upregulated in class | 1 |
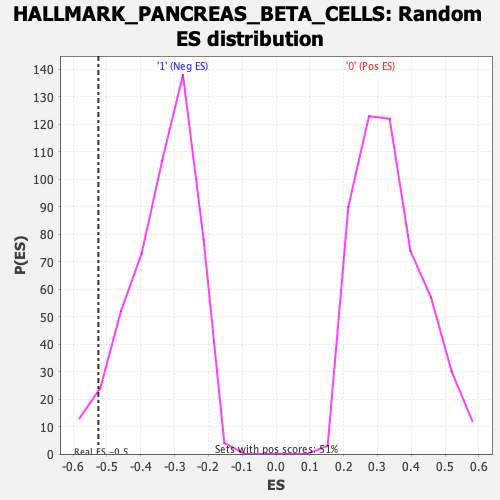
| GeneSet | HALLMARK_PANCREAS_BETA_CELLS |
| Enrichment Score (ES) | -0.5253148 |
| Normalized Enrichment Score (NES) | -1.5617037 |
| Nominal p-value | 0.047034767 |
| FDR q-value | 0.4147353 |
| FWER p-Value | 0.348 |
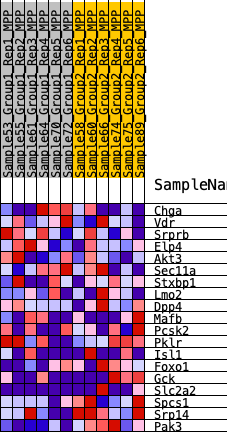
| SYMBOL | RANK IN GENE LIST | RANK METRIC SCORE | RUNNING ES | CORE ENRICHMENT | |
|---|---|---|---|---|---|
| 1 | Chga | 1231 | 0.442 | 0.0223 | No |
| 2 | Vdr | 3469 | 0.259 | -0.0423 | No |
| 3 | Srprb | 4945 | 0.183 | -0.0825 | No |
| 4 | Elp4 | 5374 | 0.163 | -0.0729 | No |
| 5 | Akt3 | 5967 | 0.136 | -0.0769 | No |
| 6 | Sec11a | 6156 | 0.128 | -0.0618 | No |
| 7 | Stxbp1 | 8939 | 0.026 | -0.1995 | No |
| 8 | Lmo2 | 10950 | -0.044 | -0.2942 | No |
| 9 | Dpp4 | 11503 | -0.062 | -0.3104 | No |
| 10 | Mafb | 11737 | -0.072 | -0.3085 | No |
| 11 | Pcsk2 | 12472 | -0.100 | -0.3267 | No |
| 12 | Pklr | 13793 | -0.154 | -0.3646 | No |
| 13 | Isl1 | 13970 | -0.163 | -0.3421 | No |
| 14 | Foxo1 | 17542 | -0.382 | -0.4513 | Yes |
| 15 | Gck | 17905 | -0.416 | -0.3893 | Yes |
| 16 | Slc2a2 | 17991 | -0.427 | -0.3109 | Yes |
| 17 | Spcs1 | 18422 | -0.482 | -0.2396 | Yes |
| 18 | Srp14 | 18673 | -0.521 | -0.1516 | Yes |
| 19 | Pak3 | 19475 | -1.005 | 0.0019 | Yes |