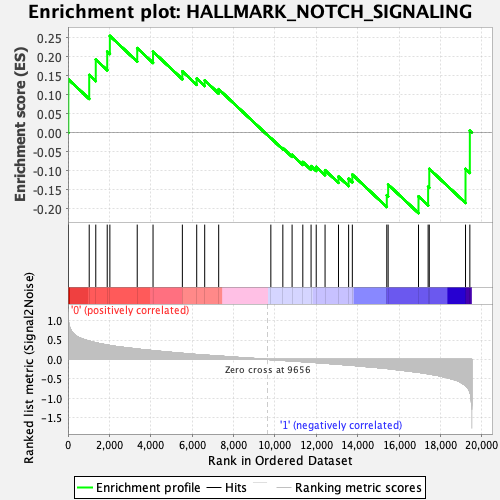
Profile of the Running ES Score & Positions of GeneSet Members on the Rank Ordered List
| Dataset | MPP.MPP_Pheno.cls#Group1_versus_Group2.MPP_Pheno.cls#Group1_versus_Group2_repos |
| Phenotype | MPP_Pheno.cls#Group1_versus_Group2_repos |
| Upregulated in class | 0 |
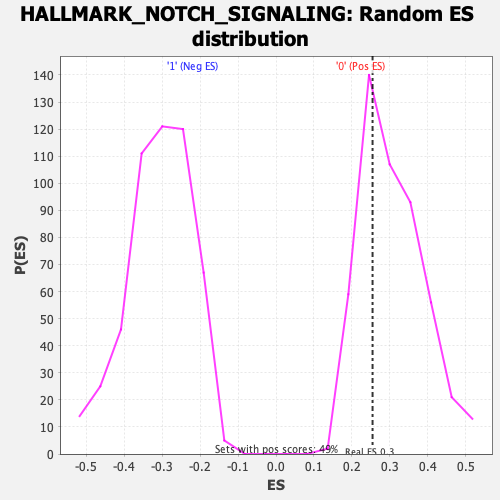
| GeneSet | HALLMARK_NOTCH_SIGNALING |
| Enrichment Score (ES) | 0.25442034 |
| Normalized Enrichment Score (NES) | 0.8338108 |
| Nominal p-value | 0.6843177 |
| FDR q-value | 0.8672529 |
| FWER p-Value | 1.0 |
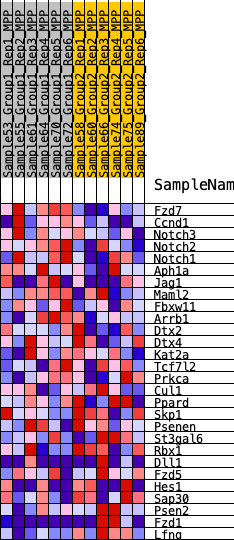
| SYMBOL | RANK IN GENE LIST | RANK METRIC SCORE | RUNNING ES | CORE ENRICHMENT | |
|---|---|---|---|---|---|
| 1 | Fzd7 | 16 | 1.058 | 0.1401 | Yes |
| 2 | Ccnd1 | 1025 | 0.474 | 0.1515 | Yes |
| 3 | Notch3 | 1342 | 0.428 | 0.1922 | Yes |
| 4 | Notch2 | 1895 | 0.369 | 0.2131 | Yes |
| 5 | Notch1 | 2023 | 0.359 | 0.2544 | Yes |
| 6 | Aph1a | 3345 | 0.267 | 0.2222 | No |
| 7 | Jag1 | 4109 | 0.224 | 0.2130 | No |
| 8 | Maml2 | 5526 | 0.156 | 0.1610 | No |
| 9 | Fbxw11 | 6219 | 0.125 | 0.1421 | No |
| 10 | Arrb1 | 6605 | 0.112 | 0.1372 | No |
| 11 | Dtx2 | 7281 | 0.086 | 0.1141 | No |
| 12 | Dtx4 | 9801 | -0.004 | -0.0146 | No |
| 13 | Kat2a | 10381 | -0.024 | -0.0411 | No |
| 14 | Tcf7l2 | 10828 | -0.039 | -0.0587 | No |
| 15 | Prkca | 11346 | -0.057 | -0.0776 | No |
| 16 | Cul1 | 11745 | -0.072 | -0.0885 | No |
| 17 | Ppard | 11994 | -0.081 | -0.0904 | No |
| 18 | Skp1 | 12421 | -0.098 | -0.0992 | No |
| 19 | Psenen | 13070 | -0.124 | -0.1160 | No |
| 20 | St3gal6 | 13559 | -0.145 | -0.1217 | No |
| 21 | Rbx1 | 13739 | -0.152 | -0.1107 | No |
| 22 | Dll1 | 15404 | -0.232 | -0.1651 | No |
| 23 | Fzd5 | 15469 | -0.236 | -0.1370 | No |
| 24 | Hes1 | 16936 | -0.332 | -0.1680 | No |
| 25 | Sap30 | 17401 | -0.369 | -0.1426 | No |
| 26 | Psen2 | 17457 | -0.374 | -0.0956 | No |
| 27 | Fzd1 | 19208 | -0.673 | -0.0958 | No |
| 28 | Lfng | 19417 | -0.836 | 0.0049 | No |